This building's market
What distinguishes The Pulse Villas
These answers describe The Pulse Villas, not an average Dubai building. Every number comes from registered DLD transactions.
- How deep is the transaction record?
- DLD recorded 3 deals over 12 months and 3 over 24 months. The latest registration is dated 14 Sept 2026.
- Which unit type has the strongest evidence?
- DLD does not yet provide a sufficiently deep unit-type sample for this building.
- When was this building most active?
- The monthly history is not yet deep enough to identify an activity peak.
- Which nearby buildings form the local comparison set?
- Published buildings in the immediate Dubai South comparison set include AZIZI VENICE 14, Azizi Venice 6, Azizi Venice 15, AZIZI VENICE 7, AZIZI VENICE 11, azizi venice 12, azizi venice 13, AZIZI VENICE 10, AZIZI VENICE 9, Azizi Venice 16, Terra Gardens - Building 1, Terra Heights Building 1, Terra Heights Building 3, Azizi Venice 6 - Building A, AZIZI VENICE 2, Terra Gardens - Building 2, Terra Heights Building 2, Terra Heights Building 4.
Investment brief from this building's data
The Pulse Villas, Dubai South: DLD registered 3 transactions over 12 months and 3 over 24 months. The latest registered transaction is dated 14 Sept 2026.
- The 12-month price benchmark is AED 2.8M, or AED 1 808 per ft².
- There is not yet enough evidence to compare two 12-month windows reliably.
- The gross-yield estimate backed by a sufficient sample is 5.1%.
- Type
- 2BR
- Deals (ready)
- 7
- Median price
- AED 2.5M
- per ft²
- 1 736
- Ejari rent, year
- AED 125K
- Gross yield
- 5.1%
- Type
- 3BR
- Deals (ready)
- 4
- Median price
- AED 3.0M
- per ft²
- 1 869
- Ejari rent, year
- —
- Gross yield
- —
| Type | Deals (ready) | Median price | per ft² | 1-yr, per ft² | Ejari rent, year | Gross yield |
|---|---|---|---|---|---|---|
| 2BR | 7 | AED 2.5M | 1 736 | +4.6% | AED 125K | 5.1% |
| 3BR | 4 | AED 3.0M | 1 869 | — | — | — |
Ready homes only, last 12 months; developer sales are not mixed in. Rent: Ejari leases for the same unit type in this building. Yield and price-per-ft² change are shown only with enough data: at least 5 sales and 5 leases.
- Type
- 2BR
- Building
- AED 2.5M
- Area
- AED 1.1M
- Difference
- +118.8%
- Building
- 1 736
- Area
- 994
- Difference
- +74.6%
- Type
- 3BR
- Building
- AED 3.0M
- Area
- AED 1.6M
- Difference
- +91.9%
- Building
- 1 869
- Area
- 981
- Difference
- +90.5%
Median price
Price per ft²
Median price
Price per ft²
This building's figures, with the area median for the same type beside them; the difference shows how far the building sits above (+) or below (−) the area. Ready homes over 12 months, developer sales not mixed in. Both are calculated by the AI broker from DLD deals.
Other buildings in the area with data
Area figures by metric
Fresh off-plan nearby
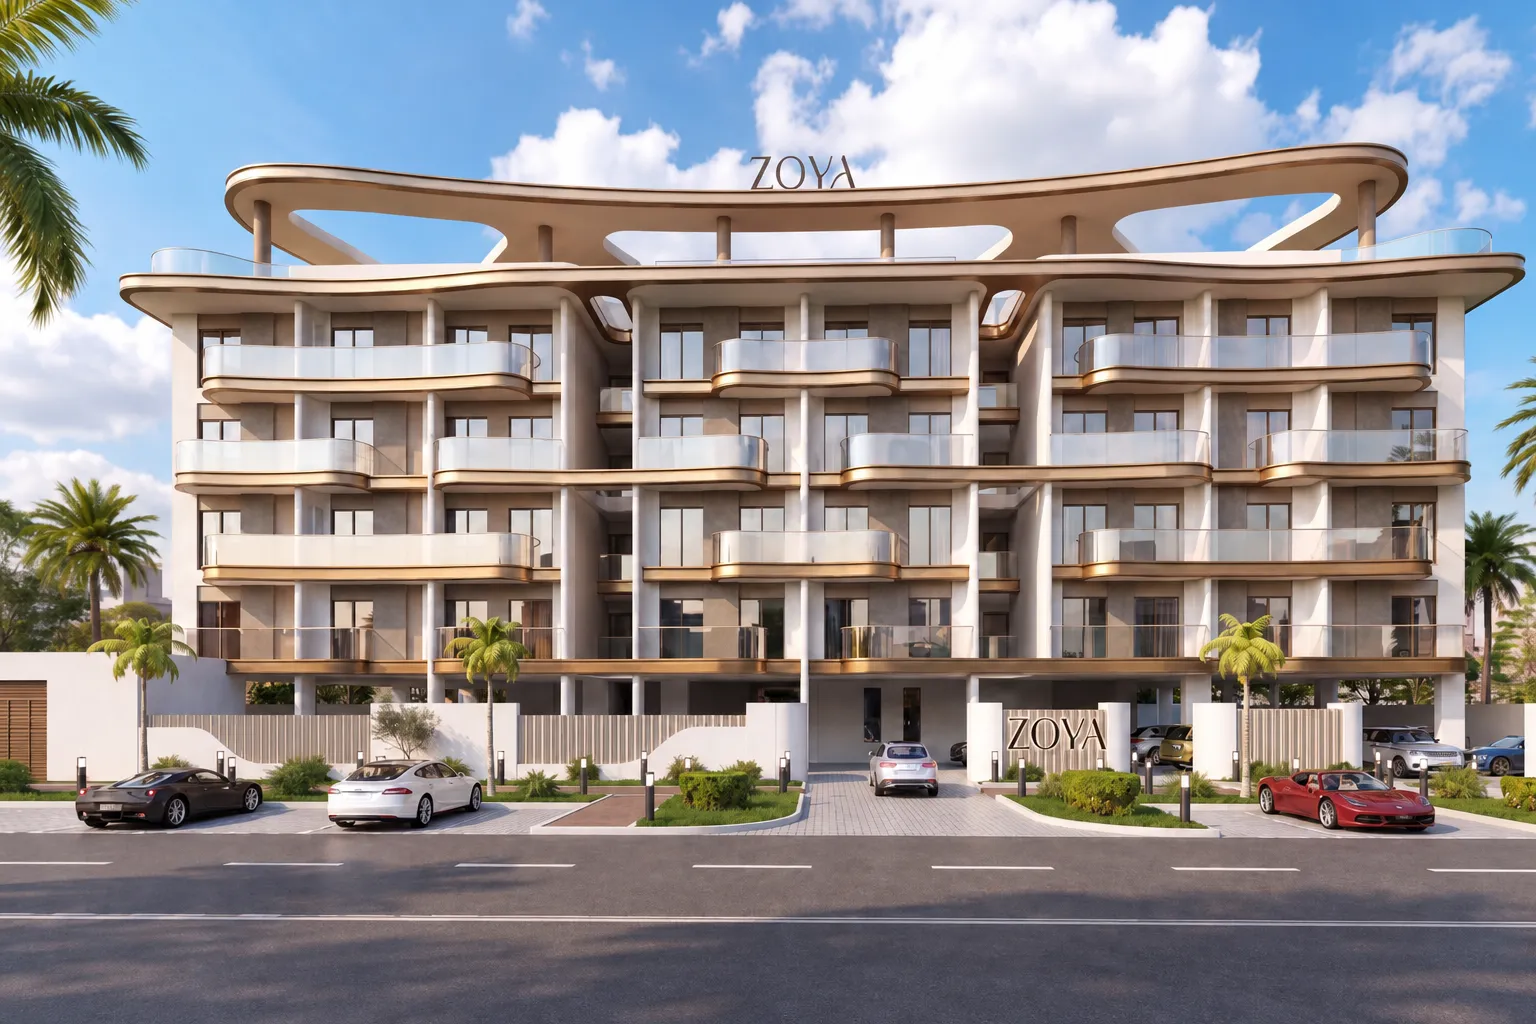
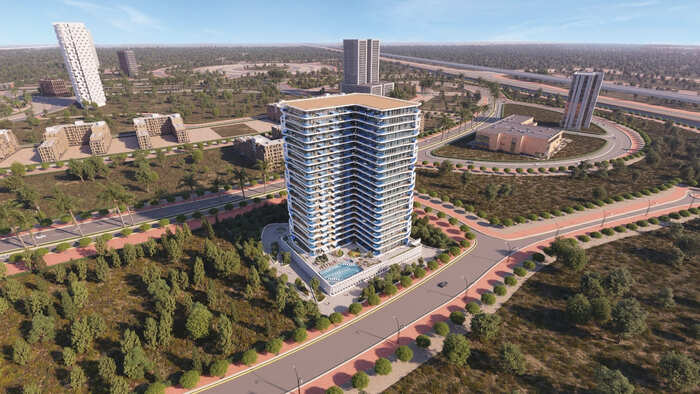
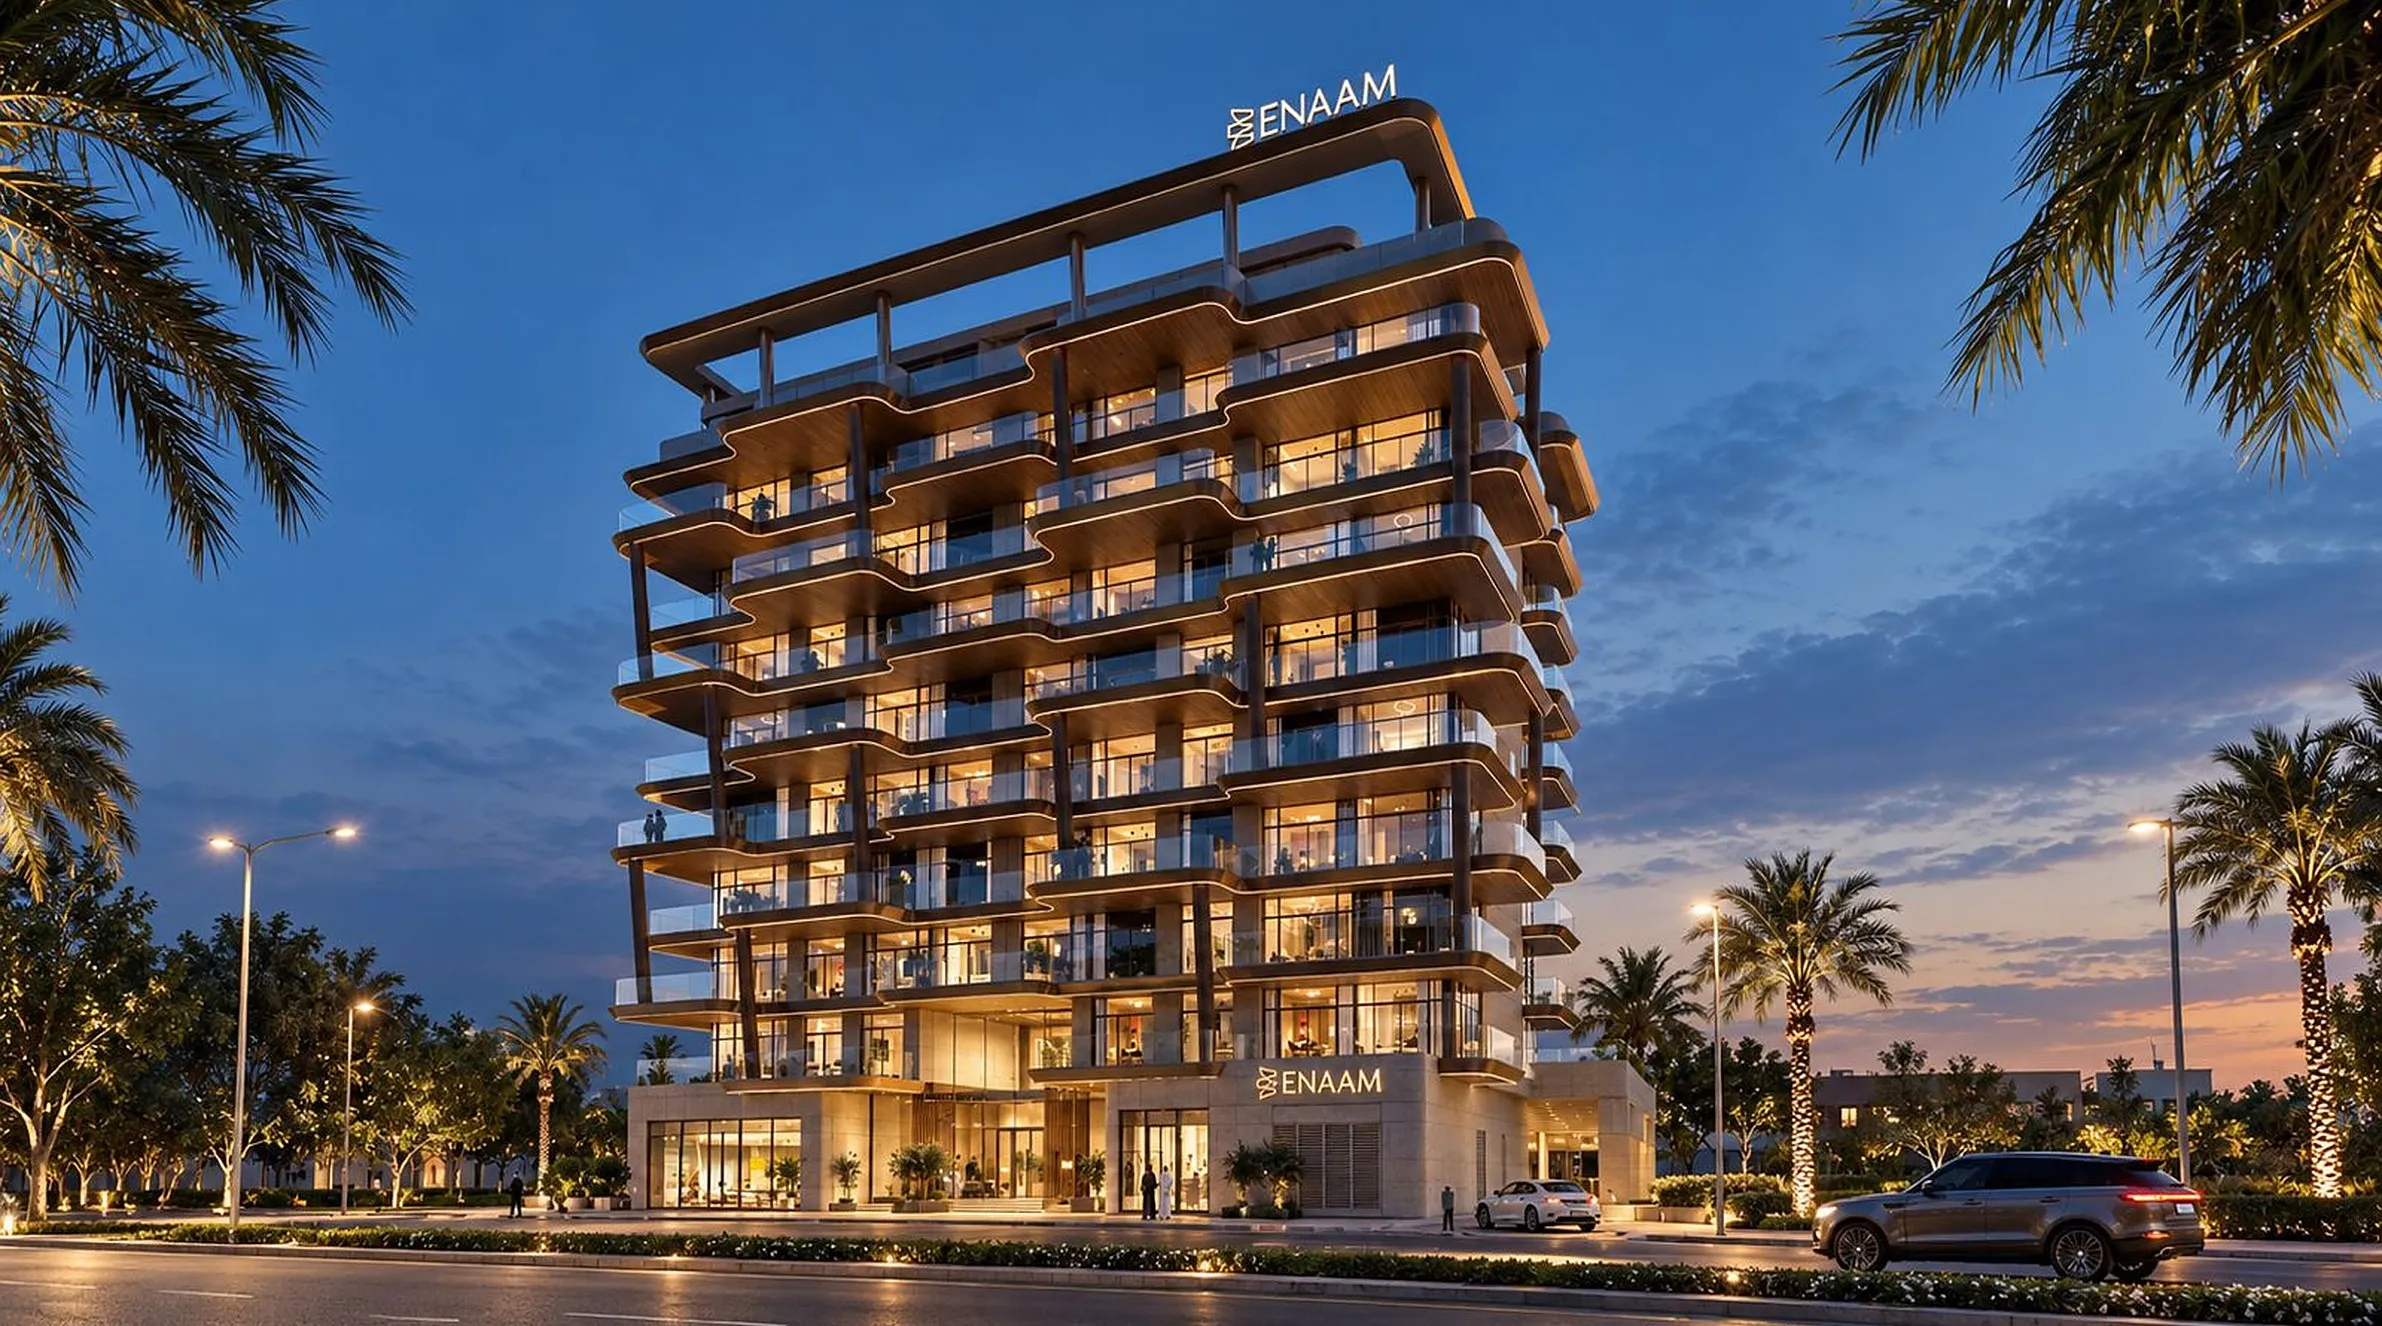
New projects in the area — developer renders
Source: Dubai Land Department (DLD). Price is a deal-count-weighted average of monthly transaction medians. Implied rent = price × gross yield; payback = 100 ÷ yield. These are gross benchmarks before service charges, vacancy, maintenance and financing; not an offer or unit valuation.
Catalogues and comparisons for more context.