Direkte DLD-Daten
Der Markt dieses Gebäudes
Preisrichtwert (12 Mon.)
AED 3.0M
Rechnerische Jahresmiete
—
Brutto-Amortisation
—
Preis je ft² (12 Mon.)
AED 2 821
Abschlüsse in 12 Mon.
263
263 in 24 Mon.
Geschätzte Bruttorendite
—
Monatliche Aktivität
DLD-Daten mit Stand 2 Oct 2026 · Letzter Abschluss: 9 Apr 2026
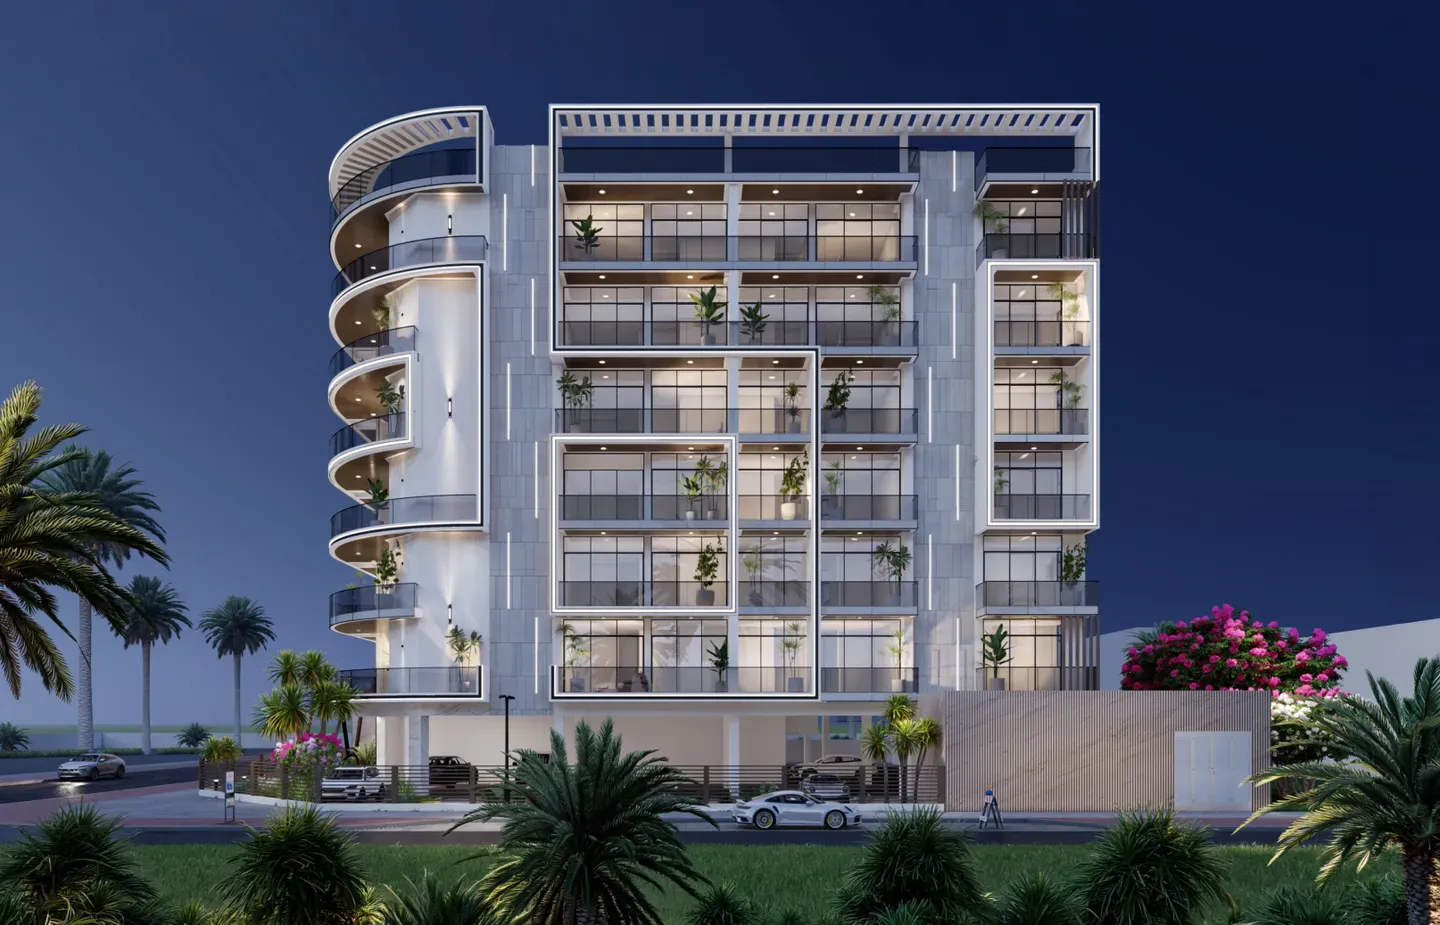
Im Bild: Arche Residences· neues Projekt im Stadtteil| Monat | Abschlüsse | Preisrichtwert | je ft² |
|---|---|---|---|
| 2026-04 | 20 | AED 3.4M | AED 2 716 |
| 2026-03 | 27 | AED 3.1M | AED 2 892 |
| 2026-02 | 32 | AED 3.0M | AED 2 890 |
| 2026-01 | 45 | AED 3.3M | AED 2 826 |
| 2025-12 | 81 | AED 3.0M | AED 2 805 |
| 2025-11 | 58 | AED 2.5M | AED 2 806 |
| Typ | Abschlüsse | Preisrichtwert | je ft² | Miete, Jahr |
|---|---|---|---|---|
| 1BR | 127 | AED 2.3M | 2 879 | — |
| 2BR | 108 | AED 3.5M | 2 756 | — |
| 3BR | 28 | AED 5.5M | 2 814 | — |
Der Mietmedian je Wohnungstyp erscheint nur dort, wo das DLD die Zimmerzahl im Mietvertrag veröffentlicht. Bei Wohnungsmietverträgen ist dieses Feld fast immer leer — die meisten Gebäude zeigen deshalb ehrlich einen Strich.
Nach DLD-Daten vergleichen:
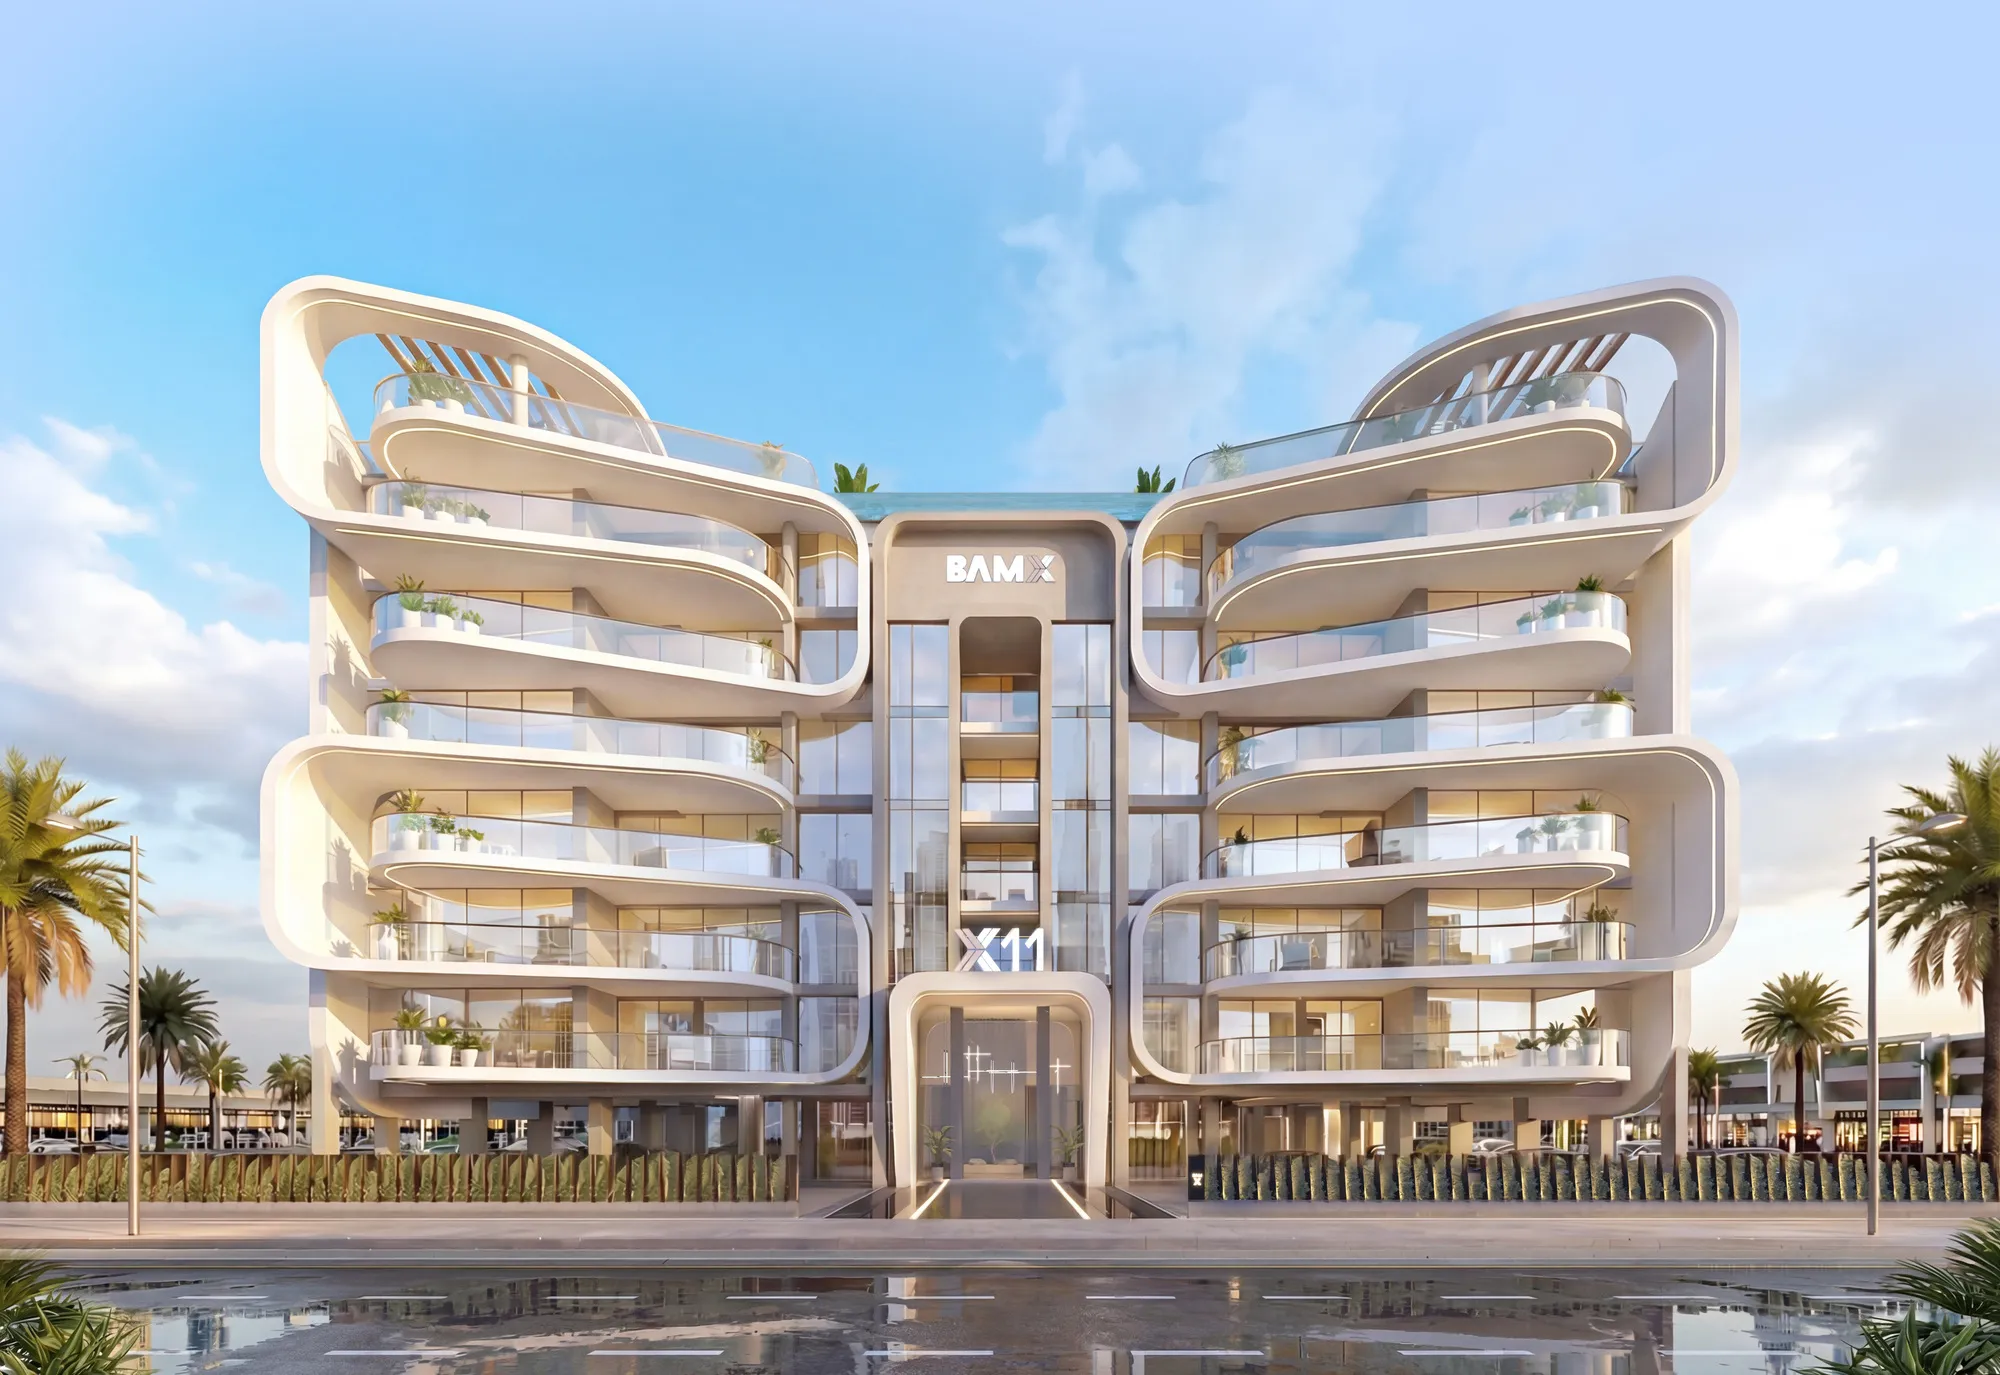
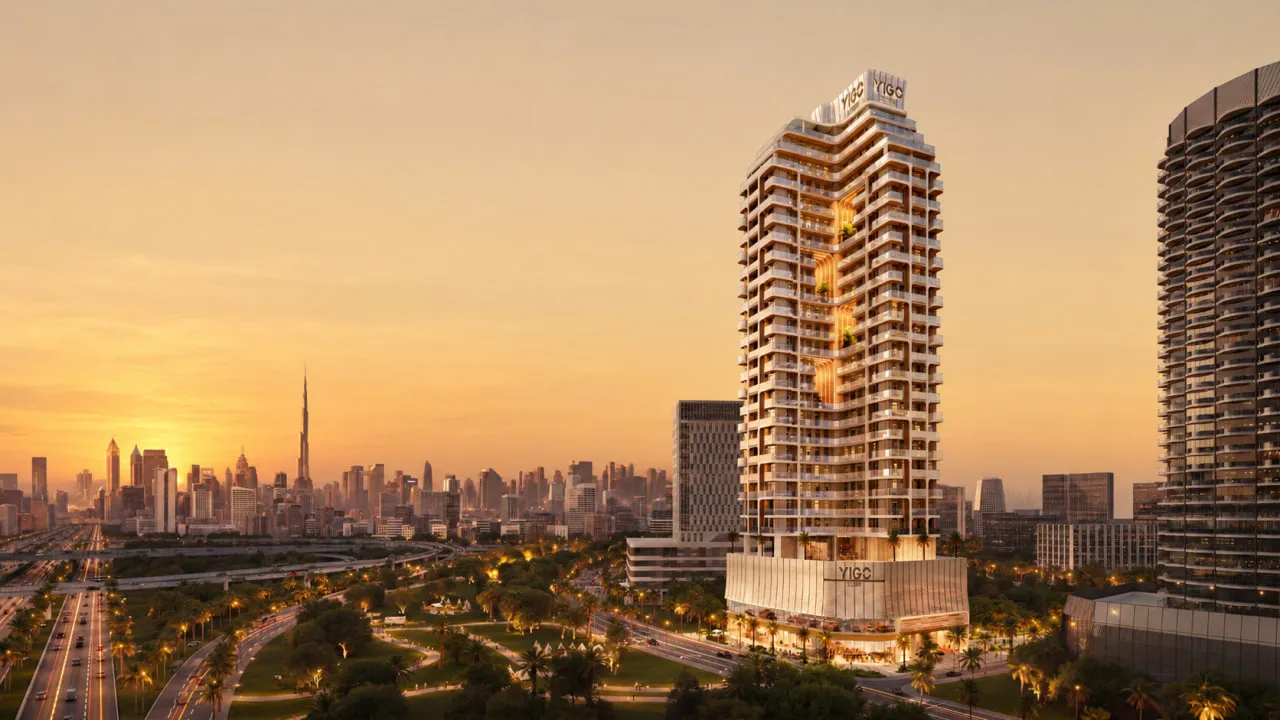
Neue Projekte im Stadtteil — Renderings des Bauträgers
Quelle: Dubai Land Department (DLD). Der Preisrichtwert ist ein nach Abschlusszahl gewichteter Mittelwert der monatlichen Mediane. Rechnerische Miete = Preis × Bruttorendite; Amortisation = 100 ÷ Rendite. Es sind Bruttowerte vor Service Charge, Leerstand, Instandhaltung und Finanzierung; kein Angebot und keine Bewertung einer einzelnen Einheit.
Kataloge und Vergleiche für mehr Kontext.