Données DLD directes
Le marché de cet immeuble
Repère de prix (12 mois)
AED 2.8M
Loyer annuel implicite
—
Retour brut
—
Prix au ft² (12 mois)
AED 3 077
Transactions sur 12 mois
158
158 sur 24 mois
Rendement brut estimé
—
Activité mensuelle
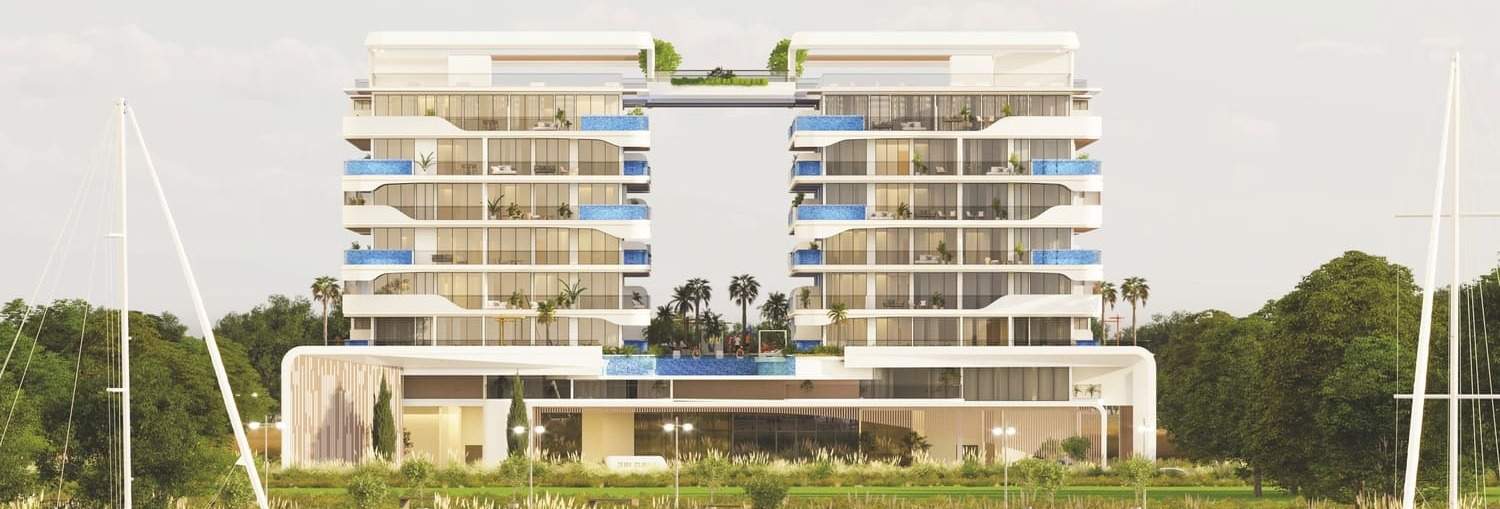
Données DLD au 30 Sept 2026 · Dernière transaction: 14 May 2026
Sur la photo: Ocean Pearl 1 and 2· projet neuf du quartier| Mois | Transactions | Repère de prix | au ft² |
|---|---|---|---|
| 2026-05 | 1 | AED 3.5M | AED 2 693 |
| 2026-04 | 4 | AED 3.3M | AED 1 960 |
| 2026-03 | 3 | AED 4.5M | AED 3 452 |
| 2026-02 | 1 | AED 3.3M | AED 2 719 |
| 2026-01 | 16 | AED 3.4M | AED 3 084 |
| 2025-12 | 28 | AED 3.4M | AED 3 238 |
| 2025-11 | 105 | AED 2.4M | AED 3 071 |
| Type | Transactions | Repère de prix | au ft² | Loyer, an |
|---|---|---|---|---|
| 1BR | 81 | AED 2.4M | 2 932 | — |
| 2BR | 61 | AED 4.0M | 3 228 | — |
| 3BR | 16 | AED 6.4M | 3 234 | — |
Le loyer médian par type de bien n'apparaît que là où le DLD publie le nombre de chambres dans le bail. Pour les baux d'appartements, ce champ est presque toujours vide : la plupart des immeubles affichent donc honnêtement un tiret.
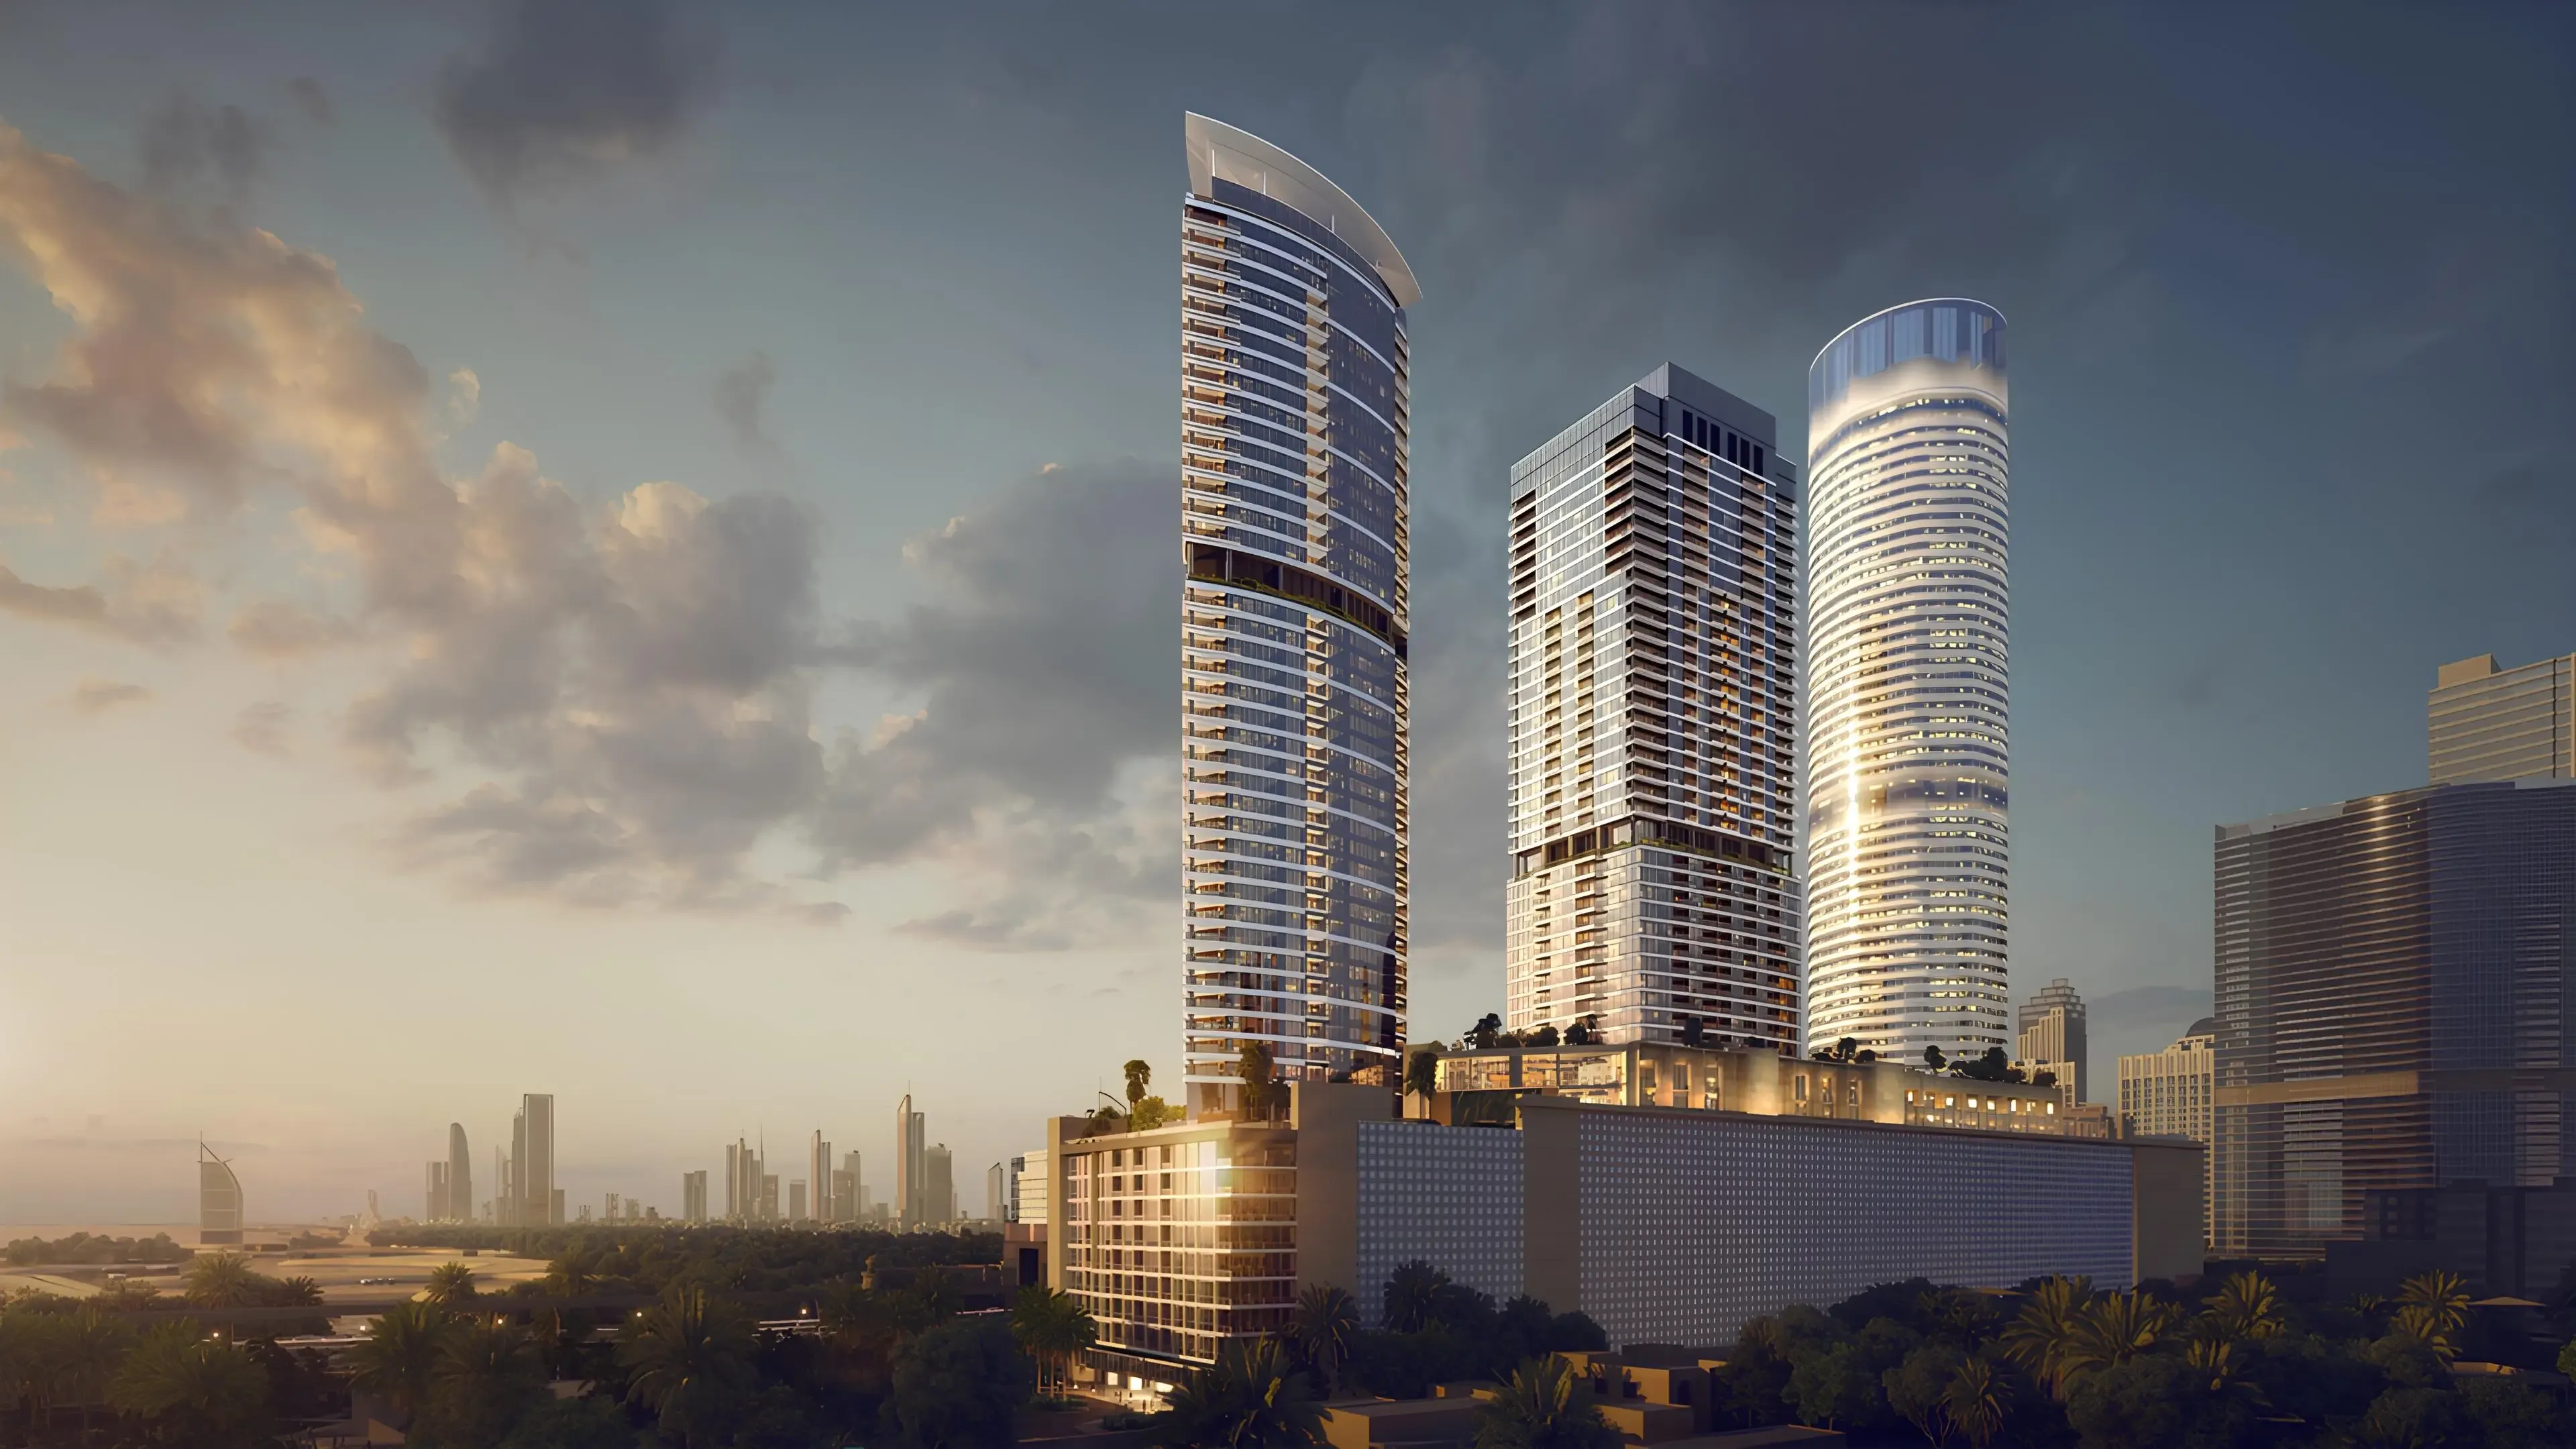
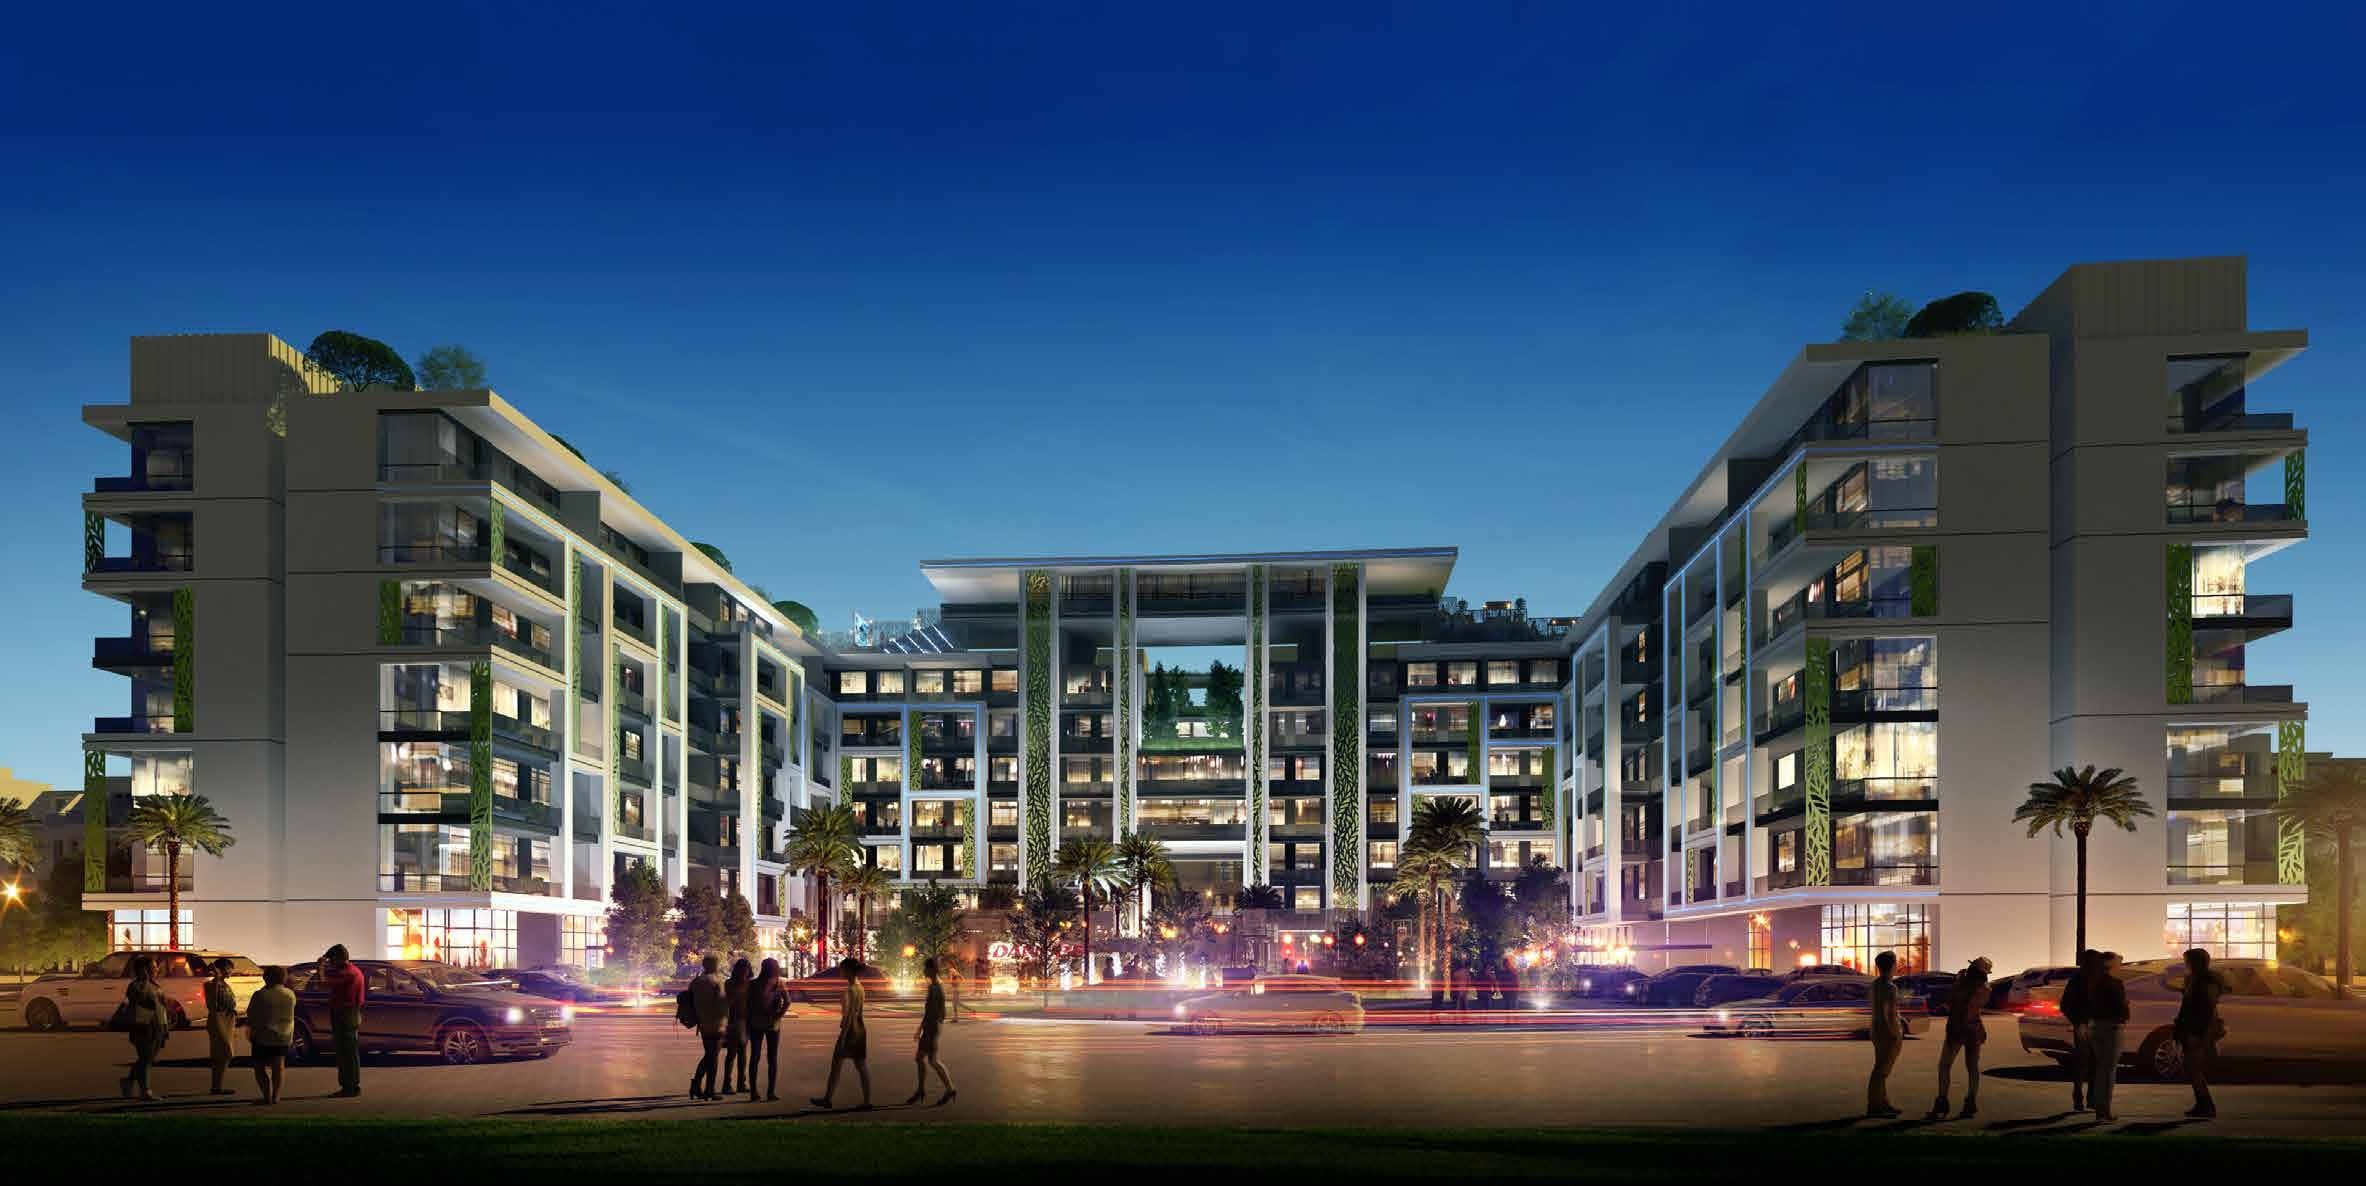
Projets neufs du quartier — visuels du promoteur
Source : Dubai Land Department (DLD). Le repère de prix est une moyenne des médianes mensuelles pondérée par le nombre de transactions. Loyer implicite = prix × rendement brut ; retour = 100 ÷ rendement. Ce sont des repères bruts, avant charges, vacance, entretien et financement ; ni une offre, ni l'évaluation d'un lot.
Catalogues et comparaisons pour plus de contexte.