DLD 直连数据
该楼盘的市场行情
价格参考(12 个月)
AED 2.7M
推算年租金
—
毛回本周期
—
每平方英尺价格(12 个月)
AED 1 441
12 个月成交
3
5 24 个月内· +50.0%
毛租金回报估算
—
走势——变化在哪里
最近 12 个月与前 12 个月对比(DLD 登记成交,不是预测)。
价格参考(12 个月)
前 12 个月
AED —
近 12 个月
AED 2.7M
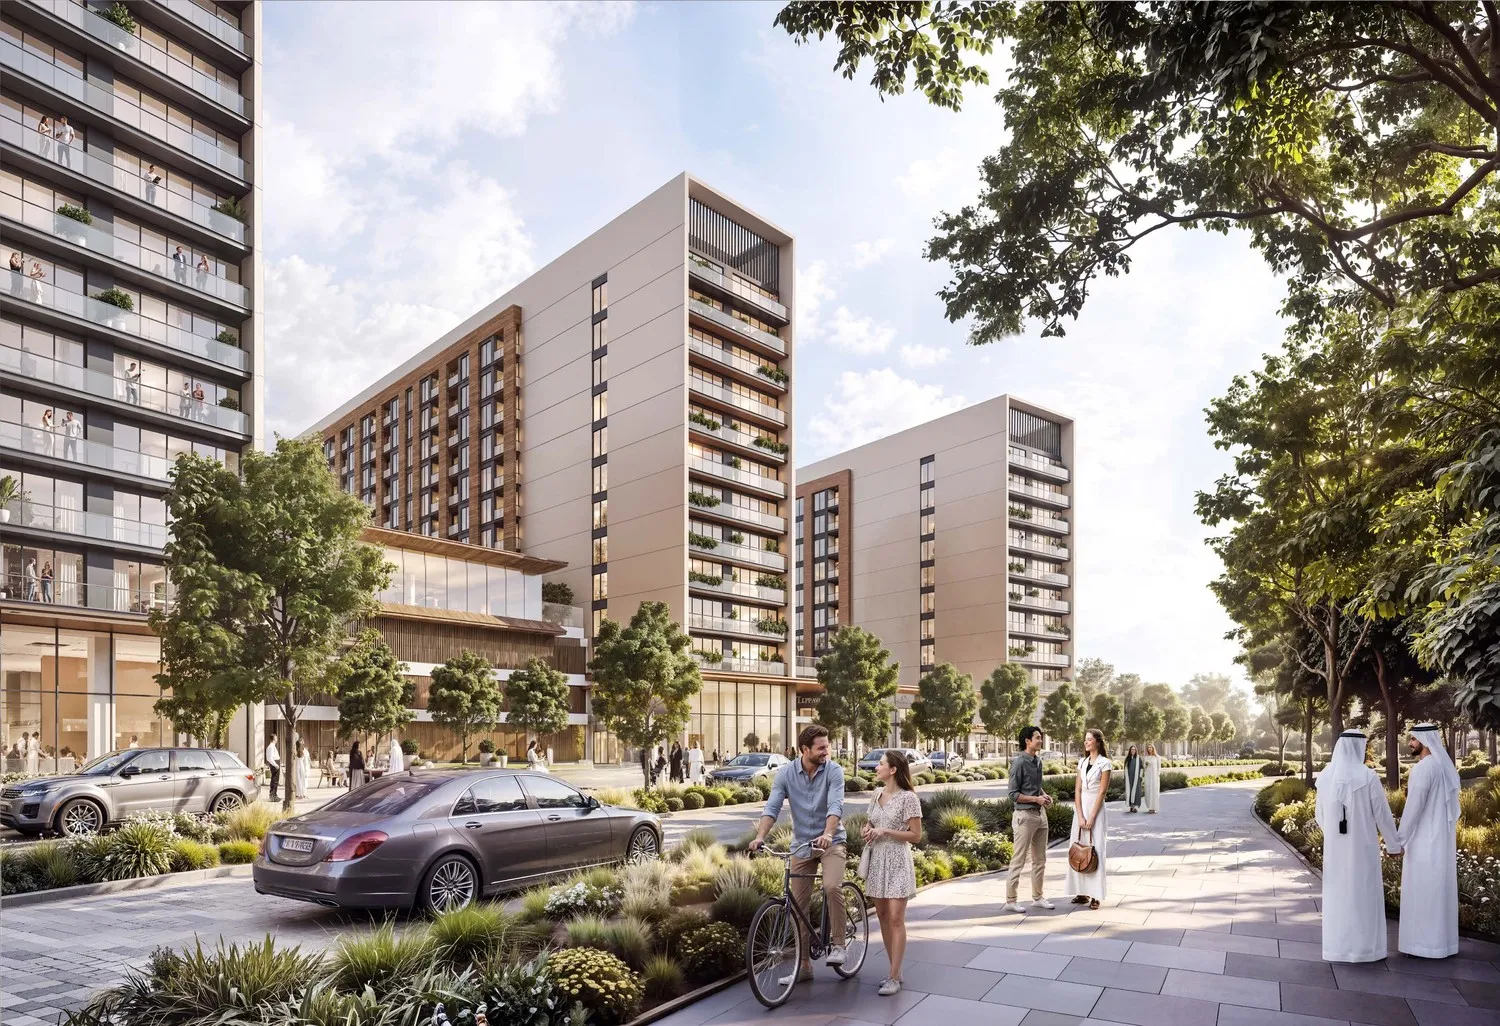
DLD 数据截至 30 Sept 2026 · 最近一笔成交: 16 Mar 2026
图为: The Woods Abode at Sobha Sanctuary· 该区域的新项目最近 12 个月与前 12 个月对比(DLD 登记成交,不是预测)。
| 月份 | 成交 | 价格参考 | 每平方英尺 |
|---|---|---|---|
| 2026-03 | 1 | AED 2.6M | AED 1 576 |
| 2026-02 | 1 | AED 2.6M | AED 1 592 |
| 2025-10 | 1 | AED 2.9M | AED 1 155 |
| 2025-02 | 1 | AED 3.0M | AED 1 388 |
| 2024-11 | 1 | AED 1.3M | AED 808 |
| 2024-06 | 2 | AED 2.2M | AED 1 243 |
| 2024-05 | 1 | AED 2.1M | AED 1 276 |
| 户型 | 成交 | 价格参考 | 每平方英尺 | 年租金 |
|---|---|---|---|---|
| 2BR | 2 | — | — | — |
| 3BR | 2 | — | — | — |
| 4BR | 1 | — | — | — |
只有当 DLD 在租约中登记了卧室数量时,才会按户型显示租金中位数。公寓租约的该字段几乎总是空白,因此多数楼盘老老实实显示一个破折号。
该区域的新项目——开发商效果图
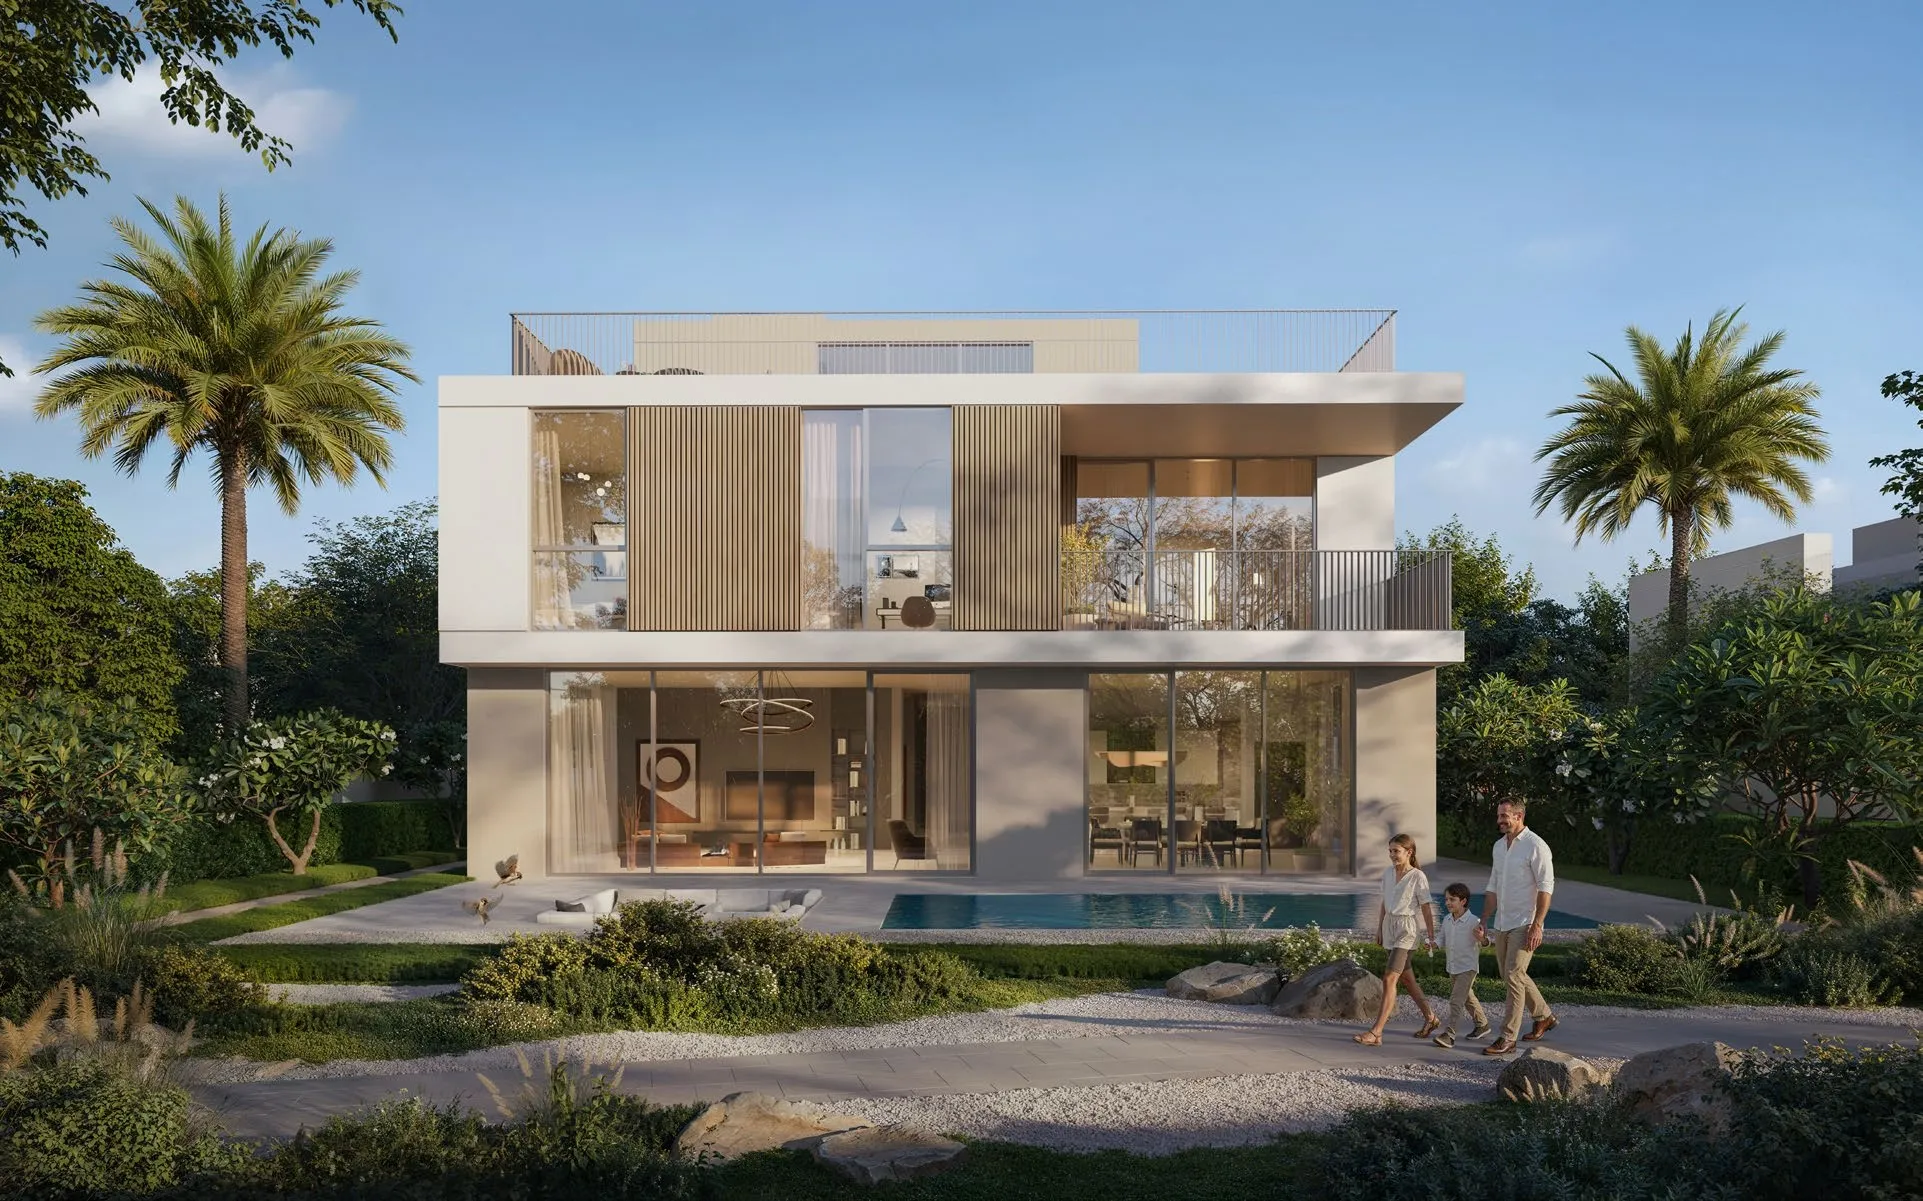
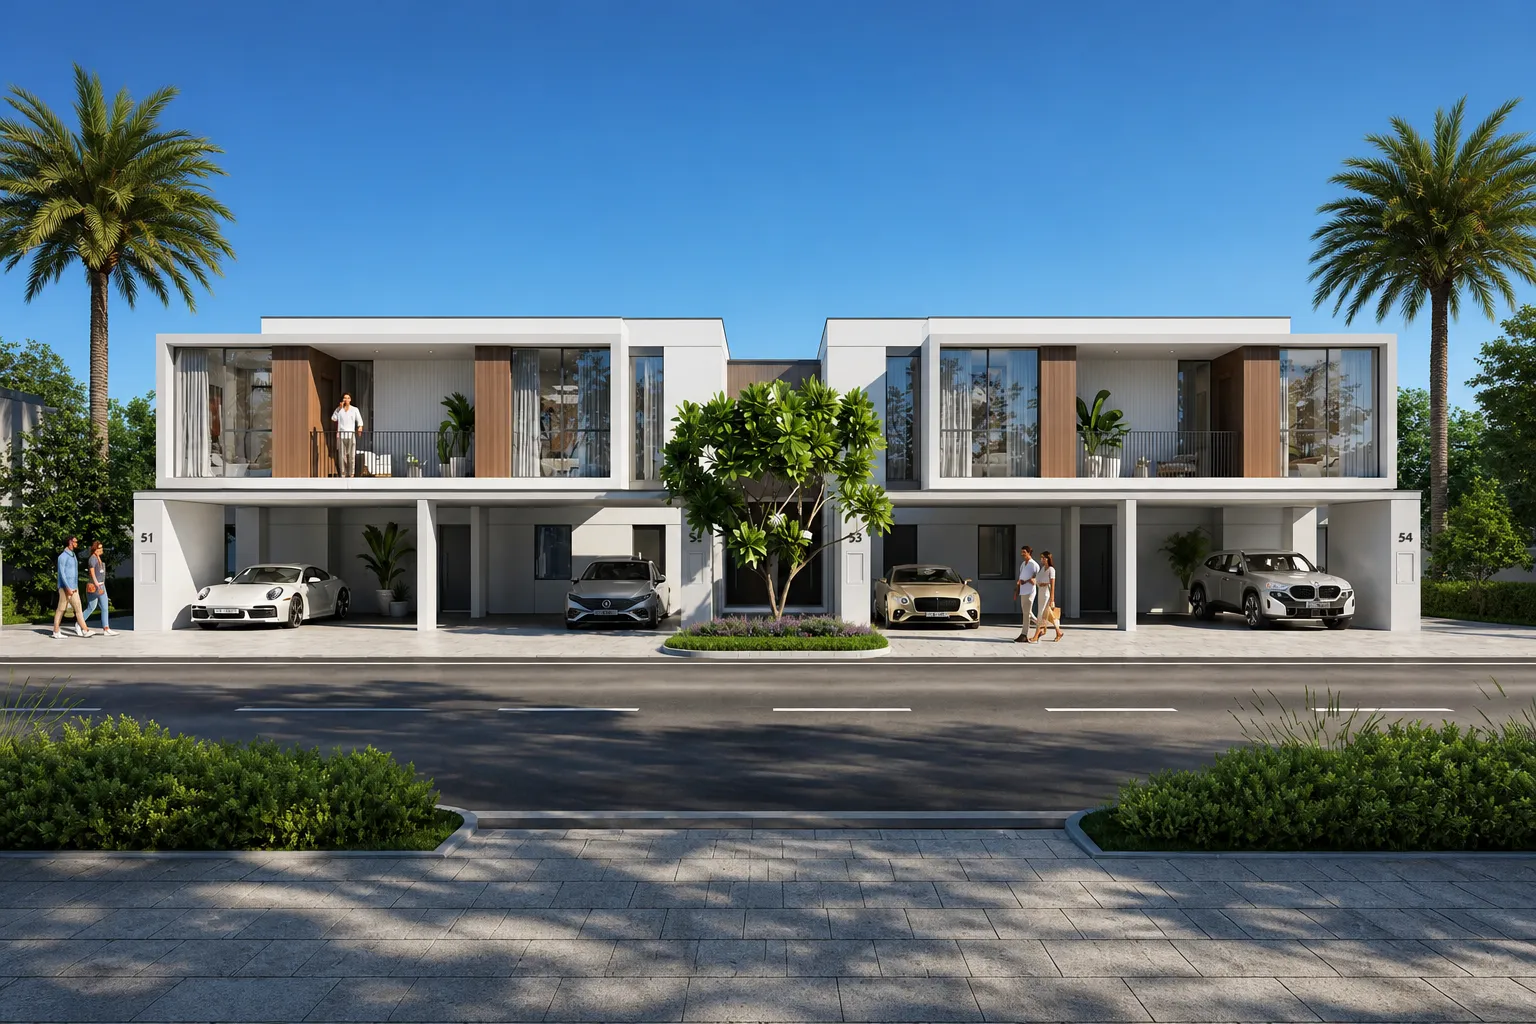
来源:迪拜土地局(DLD)。价格为按成交笔数加权的月度中位价平均值。推算租金 = 价格 × 毛回报率;回本周期 = 100 ÷ 回报率。以上均为扣除物业费、空置、维护与融资成本之前的毛值,不构成要约,也不是对某一具体单位的估值。
目录与比较,获取更多背景。