داده مستقیم DLD
بازار این ساختمان
معیار قیمت (۱۲ ماه)
AED 19M
اجاره سالانه برآوردی
—
بازگشت سرمایه ناخالص
—
قیمت هر فوت² (۱۲ ماه)
AED 3 238
معاملات ۱۲ ماه
30
30 در ۲۴ ماه
برآورد بازده ناخالص
—
فعالیت ماهانه
داده DLD تا تاریخ 1 Oct 2026 · آخرین معامله: 2 Jun 2026
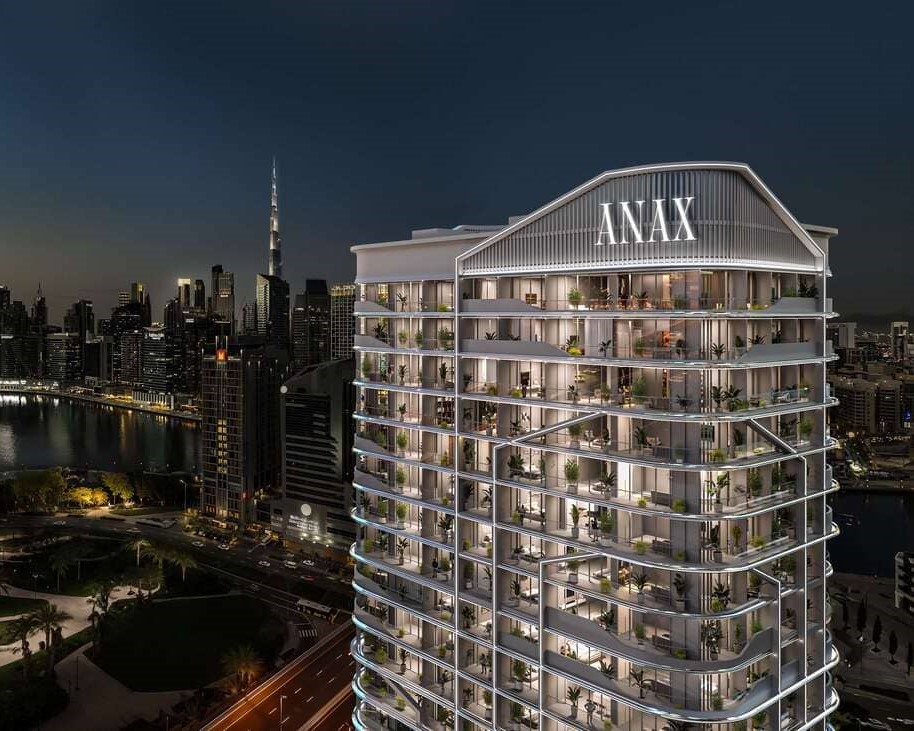
در تصویر: V-Suites· پروژه نوساز منطقه| ماه | معاملات | معیار قیمت | هر فوت² |
|---|---|---|---|
| 2026-06 | 1 | AED 20M | AED 1 652 |
| 2026-04 | 2 | AED 7.5M | AED 2 807 |
| 2026-01 | 3 | AED 29M | AED 5 181 |
| 2025-11 | 1 | AED 28M | AED 5 115 |
| 2025-10 | 23 | AED 18M | AED 3 009 |
| نوع | معاملات | معیار قیمت | هر فوت² | اجاره، سالانه |
|---|---|---|---|---|
| 1BR | 3 | — | — | — |
| 2BR | 4 | — | — | — |
| 3BR | 13 | AED 20M | 3 610 | — |
| 4BR | 8 | AED 20M | 3 179 | — |
| 4BR+ | 5 | AED 31M | 2 880 | — |
میانه اجاره بر اساس نوع واحد فقط جایی نشان داده میشود که DLD تعداد اتاقخواب را در قرارداد ثبت کرده باشد. در قراردادهای آپارتمان این فیلد تقریباً همیشه خالی است، بنابراین بیشتر ساختمانها صادقانه خط تیره نشان میدهند.
مقایسه بر پایه داده DLD:
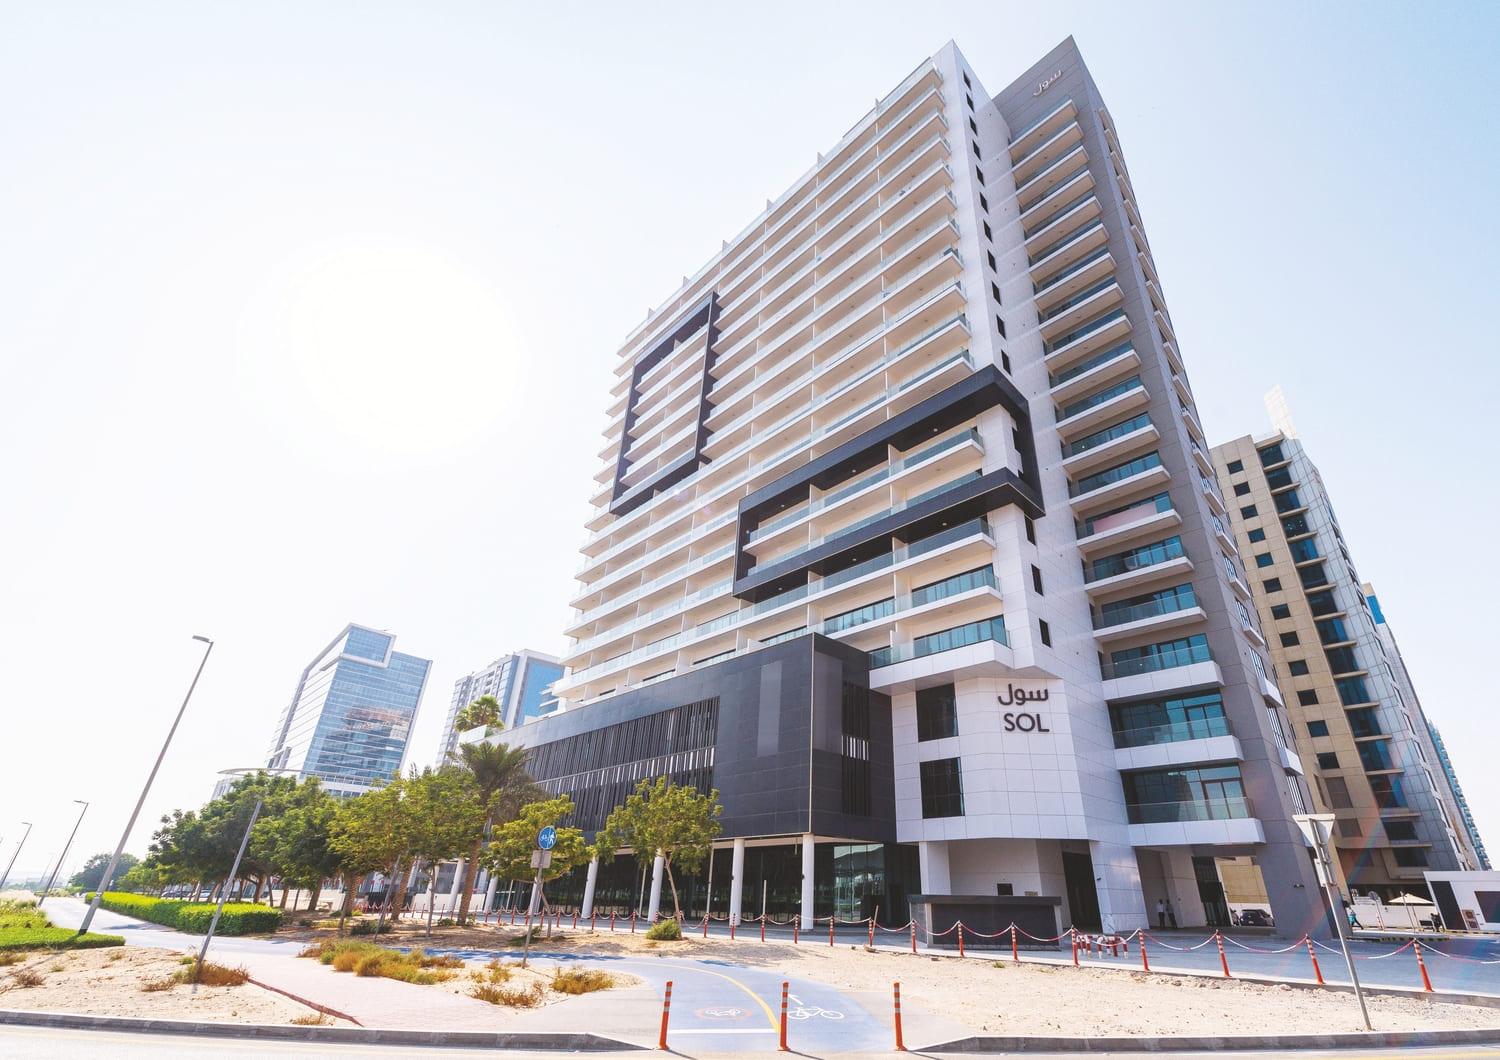
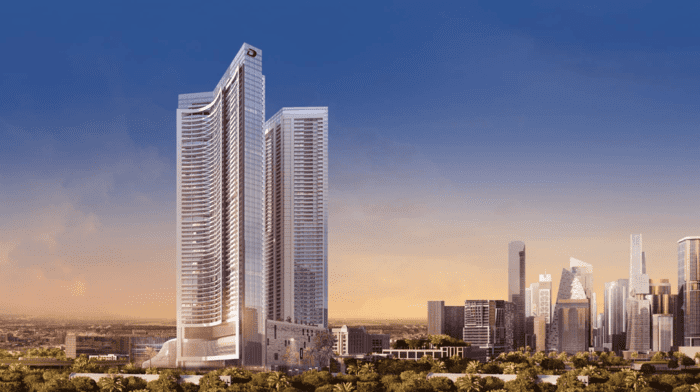
پروژههای نوساز منطقه — تصاویر سازنده
منبع: اداره اراضی و املاک دبی (DLD). معیار قیمت، میانگین وزنی میانههای ماهانه بر پایه تعداد معاملات است. اجاره برآوردی = قیمت × بازده ناخالص؛ بازگشت سرمایه = ۱۰۰ ÷ بازده. این ارقام ناخالص و پیش از سرویسچارج، دوره خالی، نگهداری و هزینه تأمین مالی هستند؛ نه پیشنهاد فروشاند و نه ارزشگذاری یک واحد مشخص.
کاتالوگها و مقایسهها برای زمینه بیشتر.