Direct DLD data
This building's market
Price benchmark (12 mo)
AED 796K
Implied annual rent
AED 70K
Gross payback
11.4 years
Price per ft² (12 mo)
AED 1 291
Deals in 12 mo
38
38 in 24 mo
Estimated gross yield
8.8%
Monthly activity
DLD data as of 1 Oct 2026 · Last deal: 28 Sept 2026
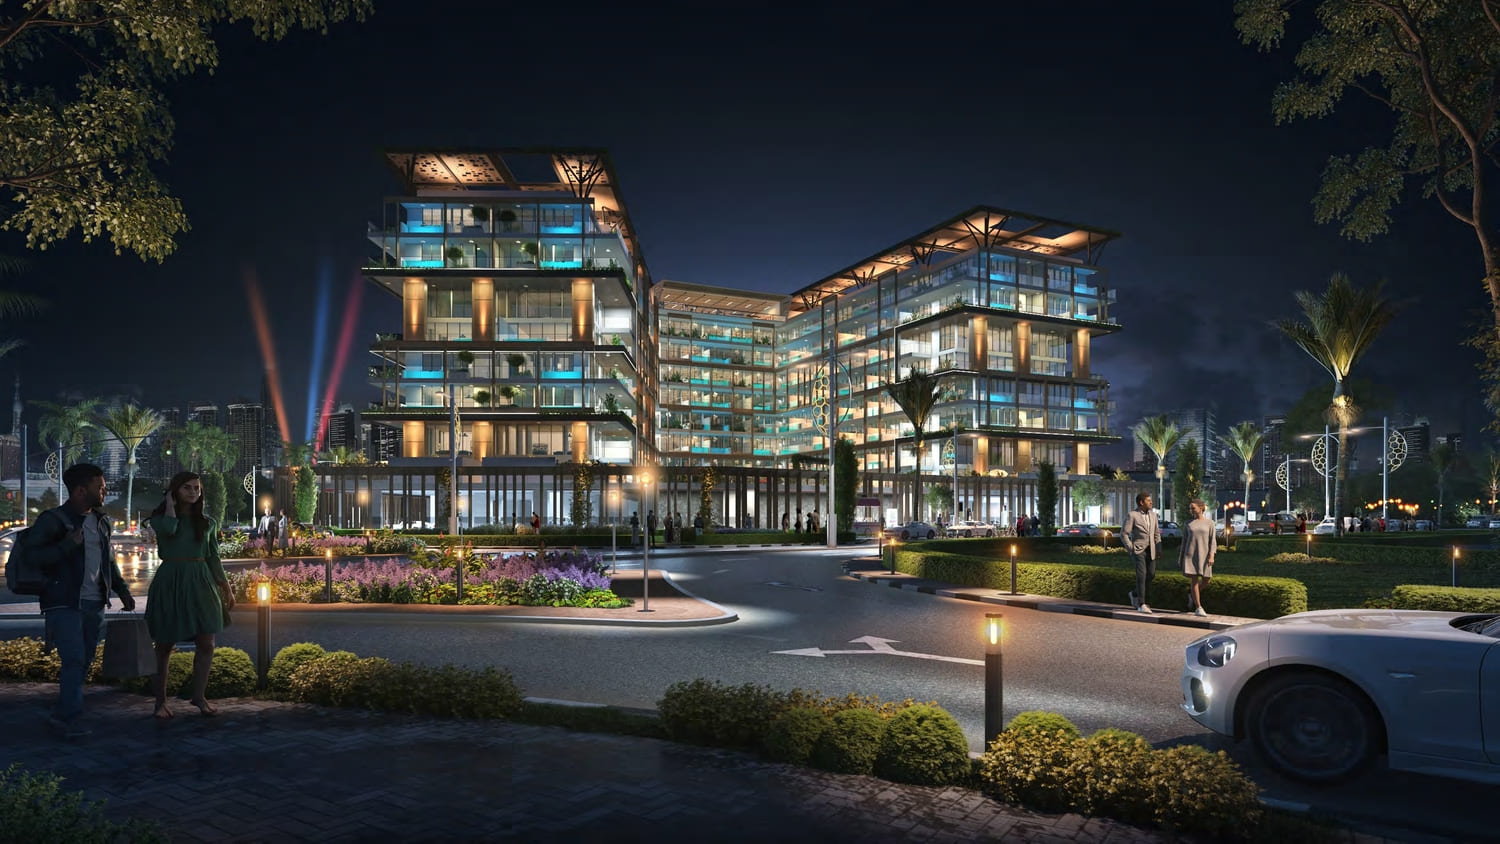
Pictured: Empire Estates· new project in the area| Month | Deals | Price benchmark | per ft² |
|---|---|---|---|
| 2026-09 | 4 | AED 655K | AED 1 710 |
| 2026-08 | 6 | AED 818K | AED 1 620 |
| 2026-07 | 7 | AED 680K | AED 1 622 |
| 2026-06 | 7 | AED 863K | AED 1 624 |
| 2026-05 | 6 | AED 870K | AED 1 626 |
| 2026-04 | 8 | AED 840K | — |
| Type | Deals | Price benchmark | per ft² | Rent, year |
|---|---|---|---|---|
| Studio | 14 | AED 632K | 1 301 | — |
| 1BR | 19 | AED 878K | 1 367 | — |
| 2BR | 5 | AED 1.4M | 970 | — |
The rent median per unit type appears only where DLD publishes the bedroom count in the lease. For apartment leases that field is almost always empty, so most buildings honestly show a dash.
Compare on DLD data:
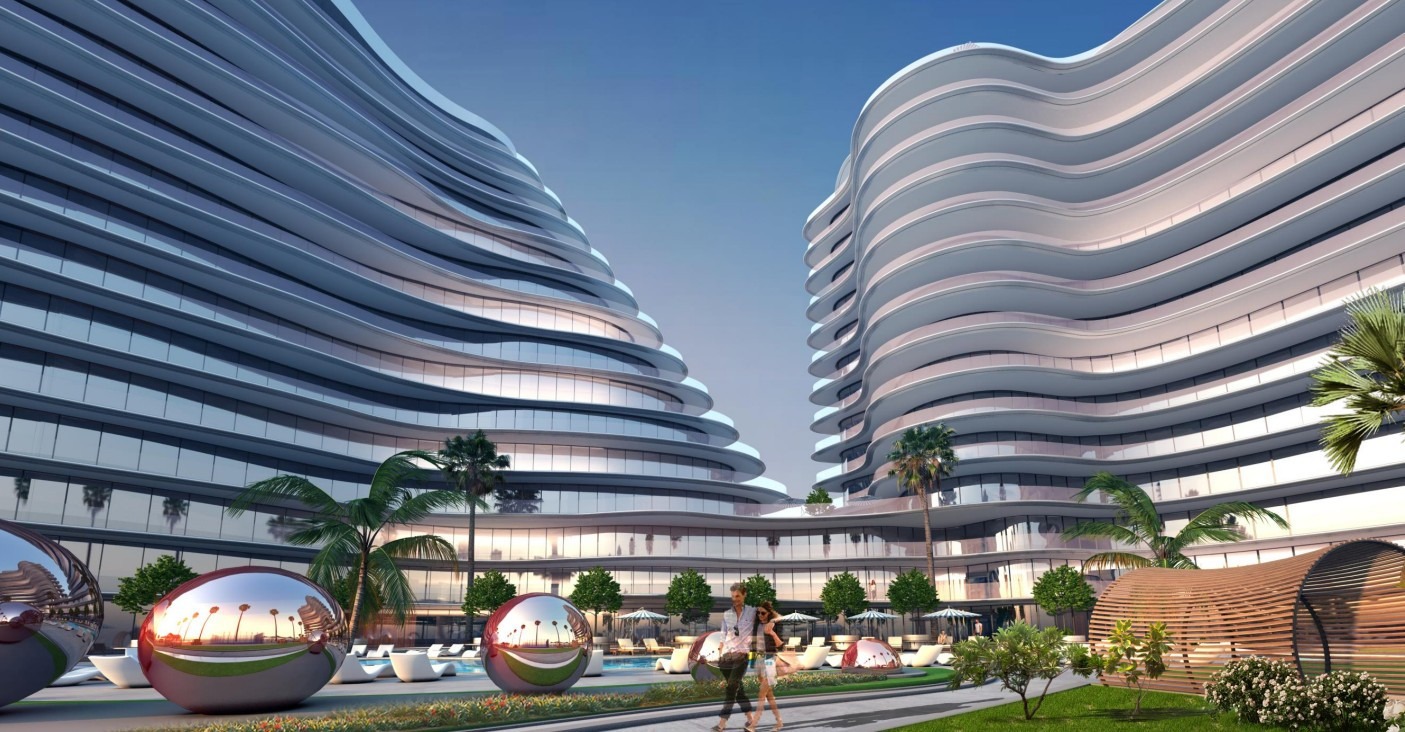
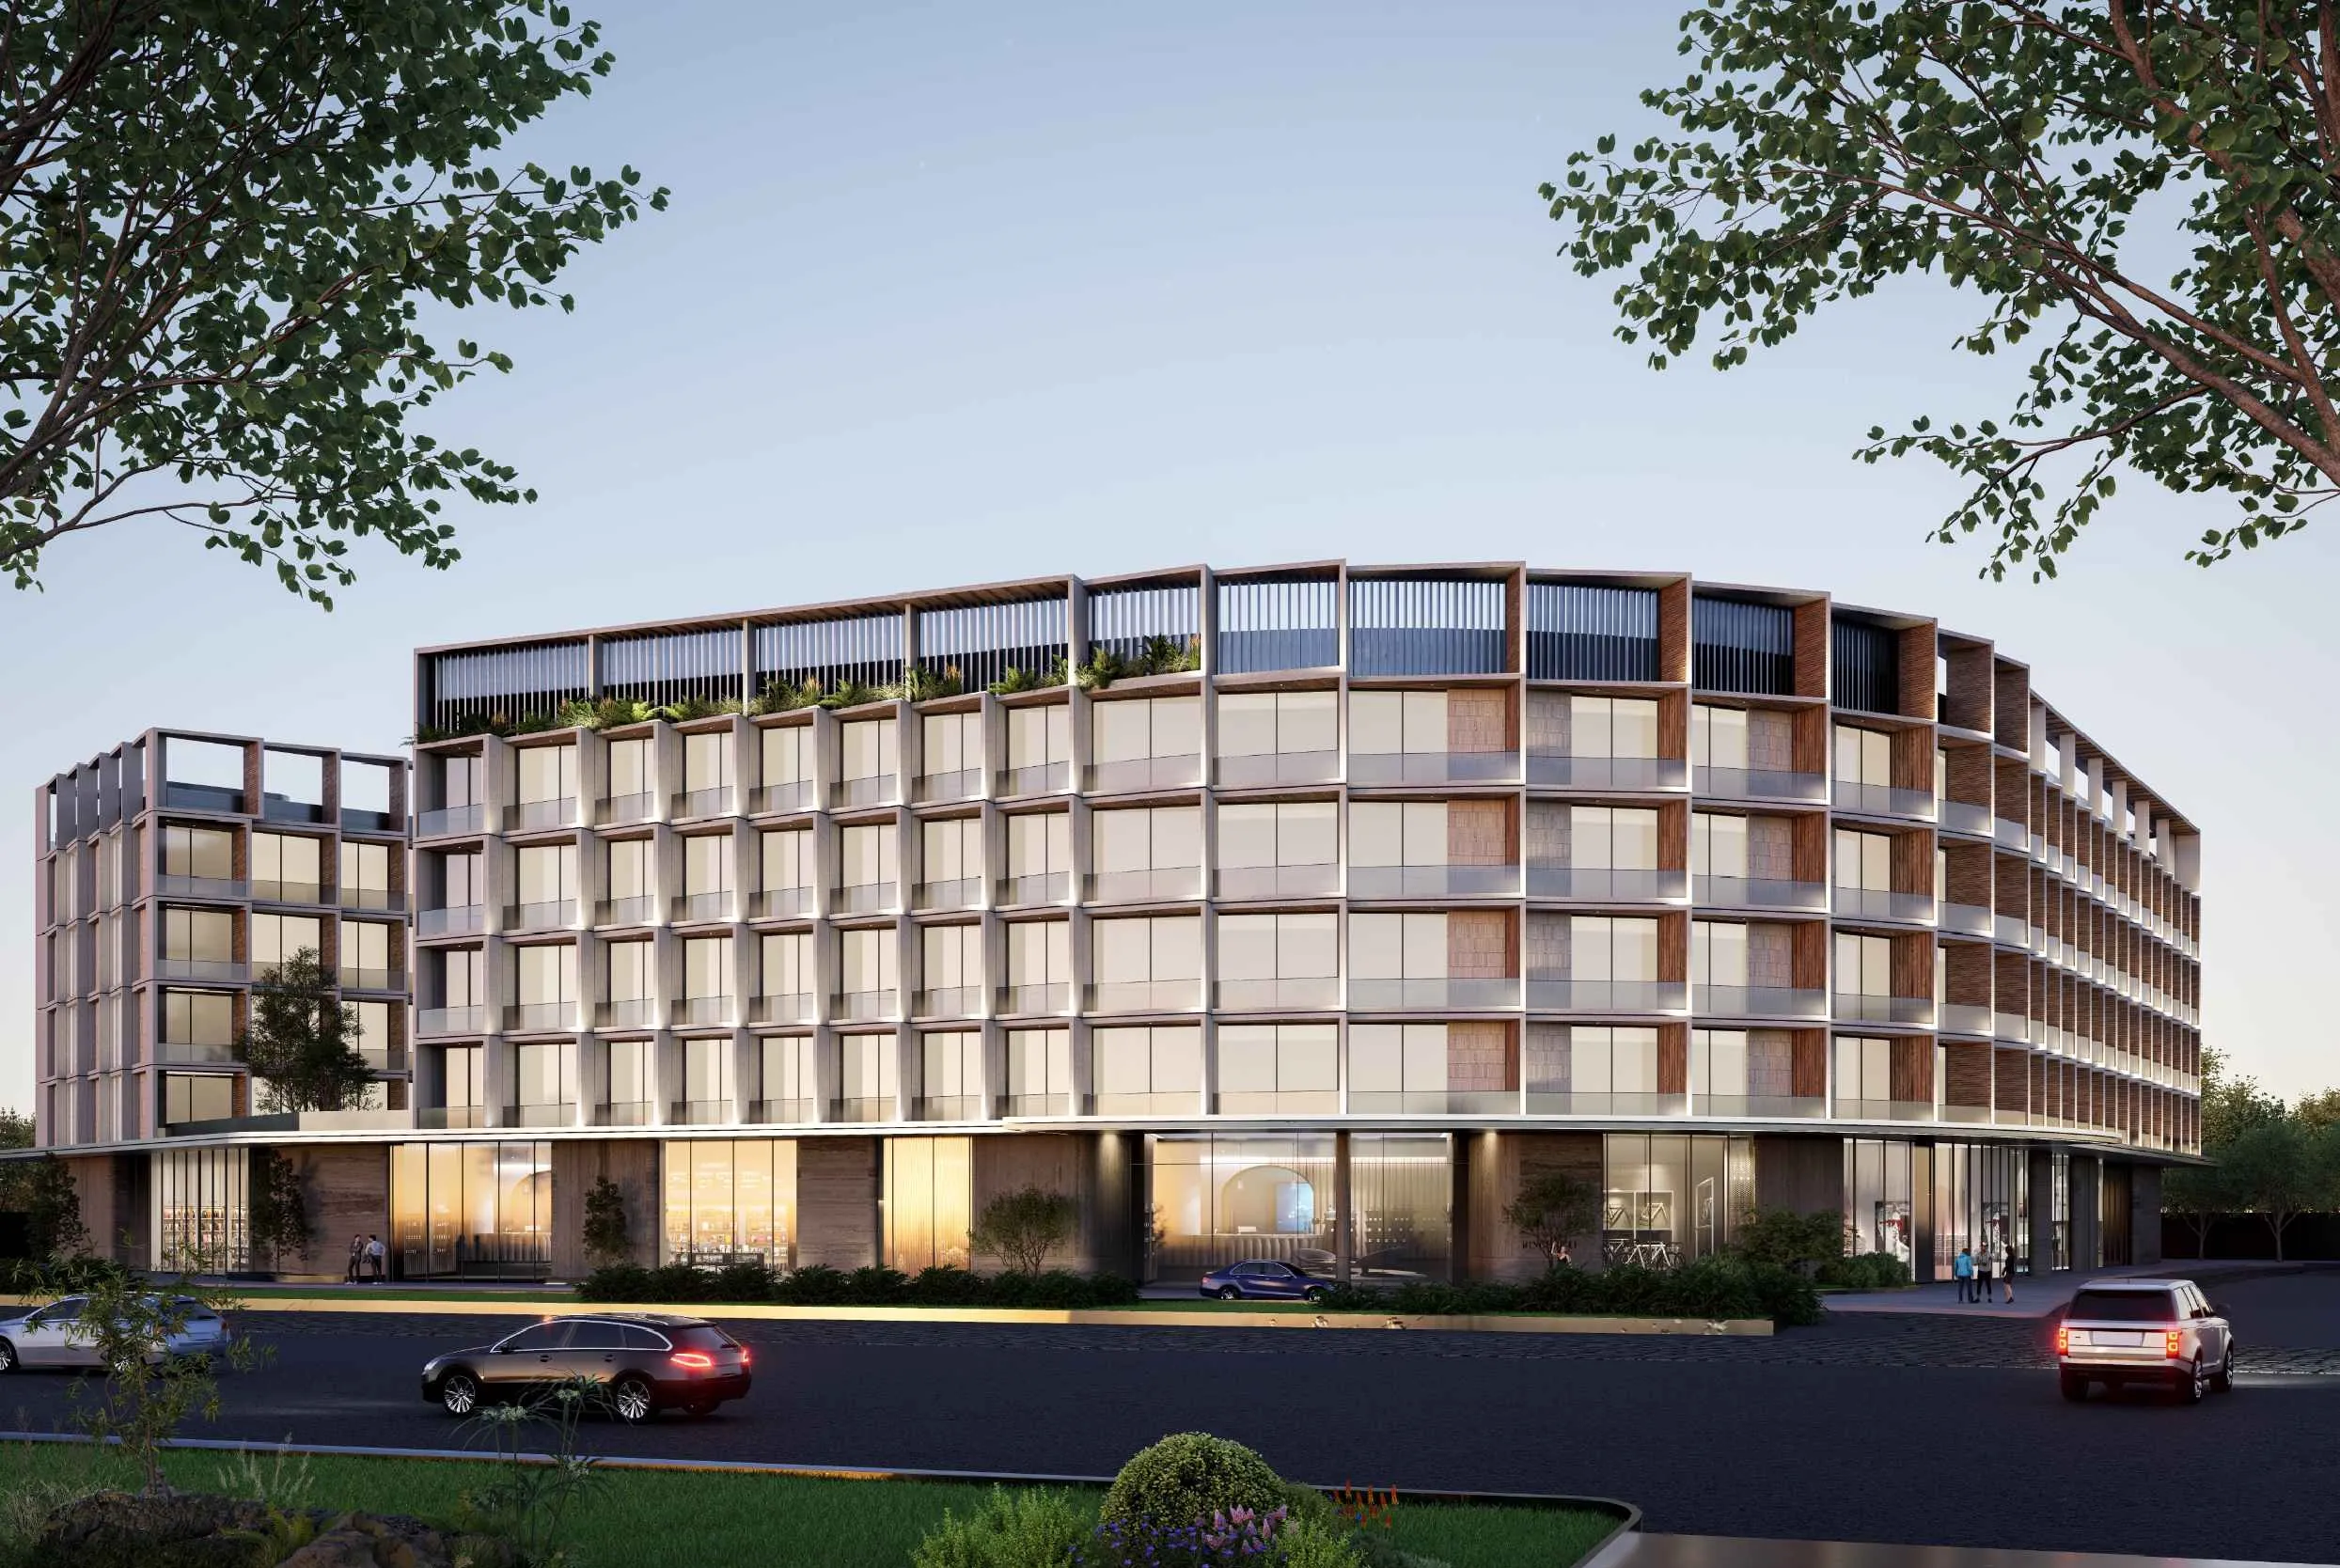
New projects in the area — developer renders
Source: Dubai Land Department (DLD). Price is a deal-count-weighted average of monthly transaction medians. Implied rent = price × gross yield; payback = 100 ÷ yield. These are gross benchmarks before service charges, vacancy, maintenance and financing; not an offer or unit valuation.
Catalogues and comparisons for more context.