Direct DLD data
This building's market
Price benchmark (12 mo)
AED 753K
Implied annual rent
—
Gross payback
—
Price per ft² (12 mo)
AED 1 540
Deals in 12 mo
41
41 in 24 mo
Estimated gross yield
—
Monthly activity
DLD data as of 2 Sept 2026 · Last deal: 31 Aug 2026
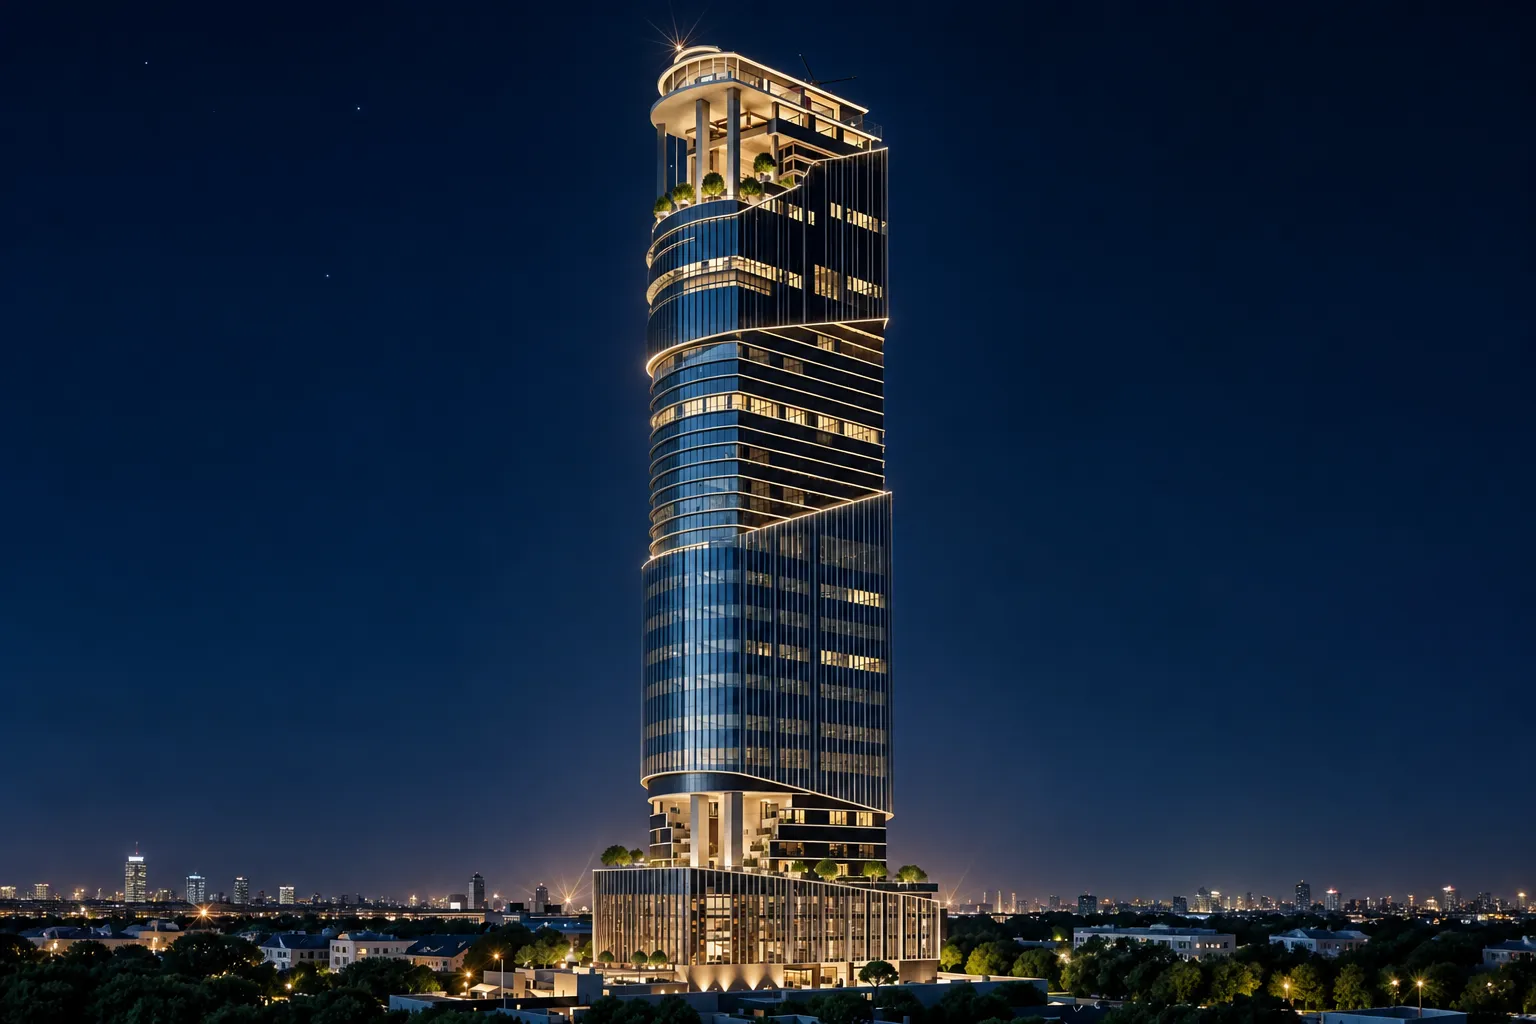
Pictured: 1970 Office Tower· new project in the area| Month | Deals | Price benchmark | per ft² |
|---|---|---|---|
| 2026-08 | 6 | AED 640K | AED 1 503 |
| 2026-07 | 6 | AED 714K | AED 1 745 |
| 2026-06 | 7 | AED 1.0M | AED 1 472 |
| 2026-05 | 20 | AED 720K | AED 1 668 |
| 2026-04 | 2 | AED 666K | — |
| Type | Deals | Price benchmark | per ft² |
|---|---|---|---|
| Studio | 26 | AED 679K | 1 488 |
| 1BR | 9 | AED 1.1M | 1 534 |
| 2BR | 4 | AED 1.8M | 1 700 |
| 3BR | 2 | AED 3.3M | 1 932 |
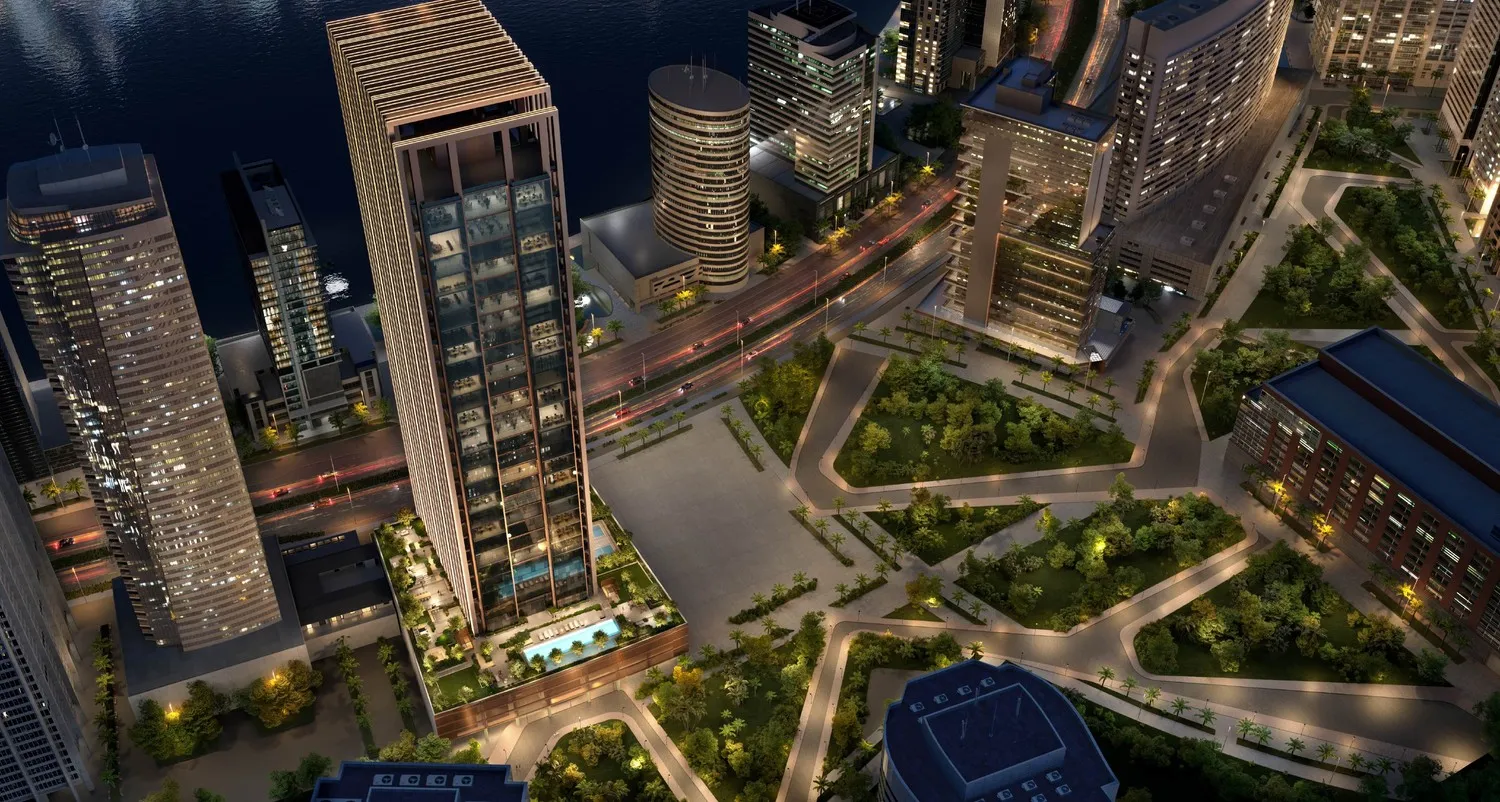
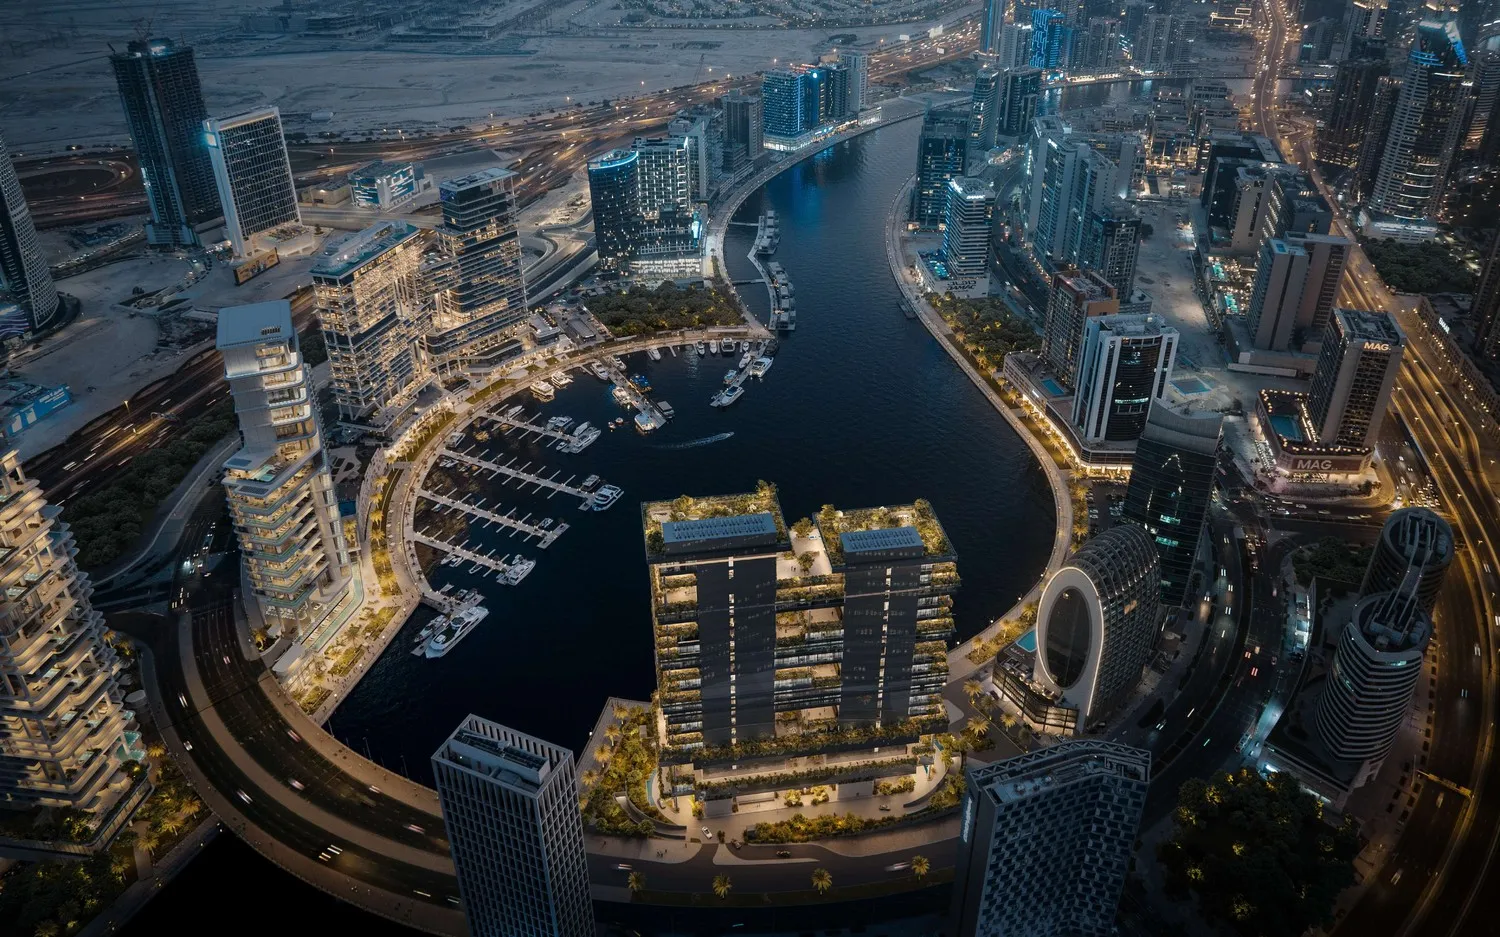
New projects in the area — developer renders
Source: Dubai Land Department (DLD). Price is a deal-count-weighted average of monthly transaction medians. Implied rent = price × gross yield; payback = 100 ÷ yield. These are gross benchmarks before service charges, vacancy, maintenance and financing; not an offer or unit valuation.
Catalogues and comparisons for more context.